

P. A. Brivio et al. : Use of Rose-diagrams for Vegetation Fire Pattern Analysis
Sept-88 (0:160)
DeC_88~(0 :1~0)_
"
....
/
\
'
, "
II / ,
1::':::::'\
-:::... \
- -1 - - -
_ - - i
-- z
-
,--/
........ --,
,/ //1 1 \\" . . . . . . .
\
/
"
I
' / I I \\../
Mar-89 (0:110)
-- -
/"-\ ~ I '~
' ....... " \ 'I ,/'
I--~ 1::::--\
i - - ' " ", - - I
\ -- -;:. I~":::- __ ,
,/ / //1 \\" .......
,
/
"
I
' / / 1\ \ /
Jun-89 (0:20)
Jan-89 (0: 60)_
/ \ I I;',
f ....... "
\~ I I. / ,
1 __ .:::::.
1 -=== -
-
-
I
\ - - /
I~
,
__ ,
,/ /1/1\\" .......
,
/
"
f
' / / 1\\/
Apr-89 (0:50)
-- -
/"\\~;'
, " \
\
....... ,\
, /
I __ .:::::"'
~ __ ,
1 - - ; ; " ' ; : - - i
, __ /
I
'
__ I
,/ /1/1\\" .......
,
/
"
I
'/II\\../
Ju l-89 (0:40)
Fetl-89 (0:100)
163
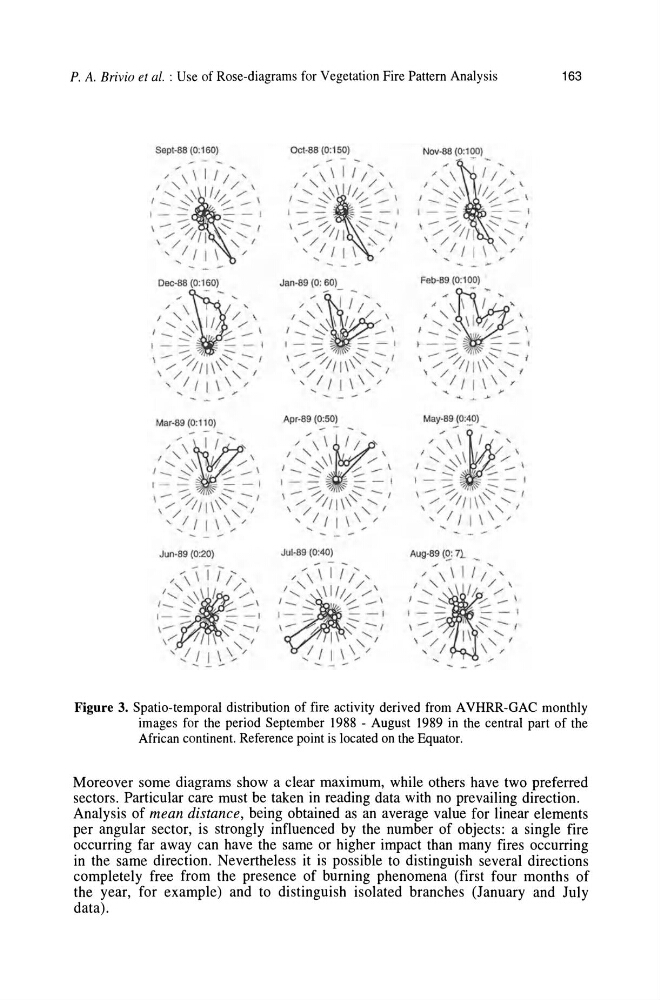
Figure 3. Spatio-temporal distribution of fire activity derived from A VHRR-GAC monthly
images for the period September 1988 - August 1989 in the central part of the
African continent. Reference point is located on the Equator.
Moreover some diagrams show a clear maximum, while others have two preferred
sectors. Particular care must be taken in reading data with no prevailing direction.
Analysis of mean distance, being obtained as an average value for linear elements
per angular sector, is strongly influenced by the number of objects: a single fire
occurring far away can have the same or higher impact than many fires occurring
in the same direction. Nevertheless it is possible to distinguish several directions
completely free from the presence of burning phenomena (first four months of
the year, for example) and to distinguish isolated branches (January and July
data).
Sept-88 (0:160)
DeC_88~(0 :1~0)_
"
....
/
\
'
, "
II / ,
1::':::::'\
-:::... \
- -1 - - -
_ - - i
-- z
-
,--/
........ --,
,/ //1 1 \\" . . . . . . .
\
/
"
I
' / I I \\../
Mar-89 (0:110)
-- -
/"-\ ~ I '~
' ....... " \ 'I ,/'
I--~ 1::::--\
i - - ' " ", - - I
\ -- -;:. I~":::- __ ,
,/ / //1 \\" .......
,
/
"
I
' / / 1\ \ /
Jun-89 (0:20)
Jan-89 (0: 60)_
/ \ I I;',
f ....... "
\~ I I. / ,
1 __ .:::::.
1 -=== -
-
-
I
\ - - /
I~
,
__ ,
,/ /1/1\\" .......
,
/
"
f
' / / 1\\/
Apr-89 (0:50)
-- -
/"\\~;'
, " \
\
....... ,\
, /
I __ .:::::"'
~ __ ,
1 - - ; ; " ' ; : - - i
, __ /
I
'
__ I
,/ /1/1\\" .......
,
/
"
I
'/II\\../
Ju l-89 (0:40)
Fetl-89 (0:100)
163
Figure 3. Spatio-temporal distribution of fire activity derived from A VHRR-GAC monthly
images for the period September 1988 - August 1989 in the central part of the
African continent. Reference point is located on the Equator.
Moreover some diagrams show a clear maximum, while others have two preferred
sectors. Particular care must be taken in reading data with no prevailing direction.
Analysis of mean distance, being obtained as an average value for linear elements
per angular sector, is strongly influenced by the number of objects: a single fire
occurring far away can have the same or higher impact than many fires occurring
in the same direction. Nevertheless it is possible to distinguish several directions
completely free from the presence of burning phenomena (first four months of
the year, for example) and to distinguish isolated branches (January and July
data).