

162
Space and Earth Remote Sensing: GIS Application to Environmental Impact Studies
Freq Jan-88
(0 : 127)
West
North
.. ,
. . ,
" , '
. , .
South
Dist Jan-88
(0: 834)
West
North
East
South
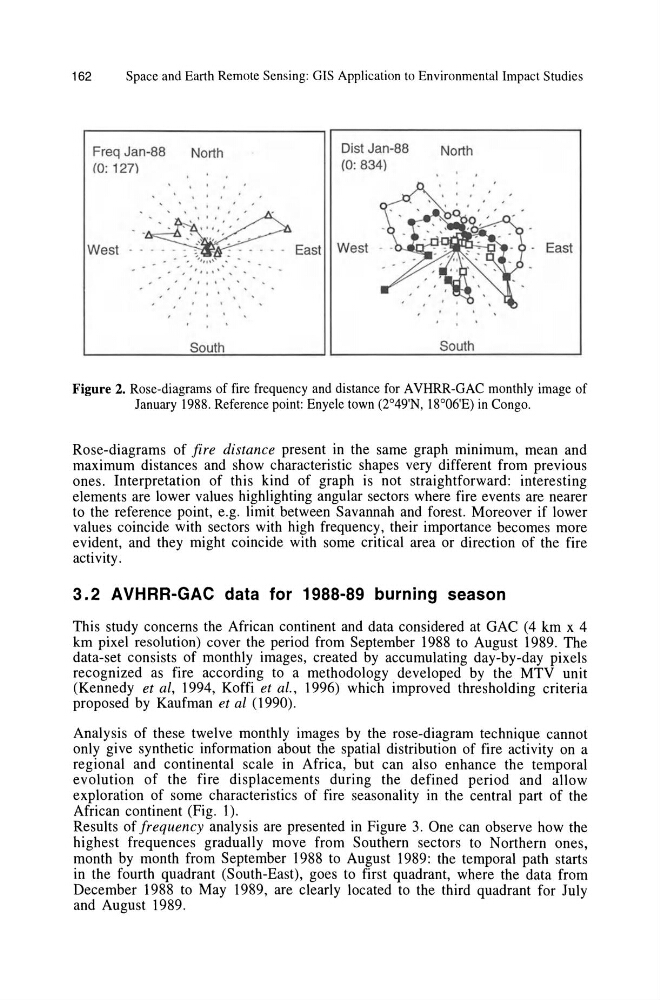
Figure 2. Rose-diagrams of fire frequency and distance for A VHRR-GAC monthly image of
January 1988. Reference point: EnyeJe town (2°49'N, 18°06'E) in Congo.
Rose-diagrams of fire distance present in the same graph minimum, mean and
maximum distances and show characteristic shapes very different from previous
ones. Interpretation of this kind of graph is not straightforward: interesting
elements are lower values highlighting angular sectors where fire events are nearer
to the reference point, e.g. limit between Savannah and forest. Moreover if lower
values coincide with sectors with high frequency, their importance becomes more
evident, and they might coincide with some critical area or direction of the fire
activity.
3.2 AVHRR-GAC data for 1988-89 burning season
This study concerns the African continent and data considered at GAC (4 km x 4
km pixel resolution) cover the period from September 1988 to August 1989. The
data-set consists of monthly images, created by accumulating day-by-day pixels
recognized as fire according to a methodology developed by the MTV unit
(Kennedy et ai, 1994, Koffi et al., 1996) which improved thresholding criteria
proposed by Kaufman et al (J 990).
Analysis of these twelve monthly images by the rose-diagram technique cannot
only give synthetic information about the spatial distribution of fire activity on a
regional and continental scale in Africa, but can also enhance the temporal
evolution of the fire displacements during the defined period and allow
exploration of some characteristics of fire seasonality in the central part of the
African continent (Fig. I).
Results of frequency analysis are presented in Figure 3. One can observe how the
highest frequences gradually move from Southern sectors to Northern ones,
month by month from September 1988 to August 1989: the temporal path starts
in the fourth quadrant (South-East), goes to first quadrant, where the data from
December 1988 to May 1989, are clearly located to the third quadrant for July
and August 1989.
Space and Earth Remote Sensing: GIS Application to Environmental Impact Studies
Freq Jan-88
(0 : 127)
West
North
.. ,
. . ,
" , '
. , .
South
Dist Jan-88
(0: 834)
West
North
East
South
Figure 2. Rose-diagrams of fire frequency and distance for A VHRR-GAC monthly image of
January 1988. Reference point: EnyeJe town (2°49'N, 18°06'E) in Congo.
Rose-diagrams of fire distance present in the same graph minimum, mean and
maximum distances and show characteristic shapes very different from previous
ones. Interpretation of this kind of graph is not straightforward: interesting
elements are lower values highlighting angular sectors where fire events are nearer
to the reference point, e.g. limit between Savannah and forest. Moreover if lower
values coincide with sectors with high frequency, their importance becomes more
evident, and they might coincide with some critical area or direction of the fire
activity.
3.2 AVHRR-GAC data for 1988-89 burning season
This study concerns the African continent and data considered at GAC (4 km x 4
km pixel resolution) cover the period from September 1988 to August 1989. The
data-set consists of monthly images, created by accumulating day-by-day pixels
recognized as fire according to a methodology developed by the MTV unit
(Kennedy et ai, 1994, Koffi et al., 1996) which improved thresholding criteria
proposed by Kaufman et al (J 990).
Analysis of these twelve monthly images by the rose-diagram technique cannot
only give synthetic information about the spatial distribution of fire activity on a
regional and continental scale in Africa, but can also enhance the temporal
evolution of the fire displacements during the defined period and allow
exploration of some characteristics of fire seasonality in the central part of the
African continent (Fig. I).
Results of frequency analysis are presented in Figure 3. One can observe how the
highest frequences gradually move from Southern sectors to Northern ones,
month by month from September 1988 to August 1989: the temporal path starts
in the fourth quadrant (South-East), goes to first quadrant, where the data from
December 1988 to May 1989, are clearly located to the third quadrant for July
and August 1989.