

P. A. Brivio et al. : Use of Rose-diagrams for Vegetation Fire Pattern Analysis
161
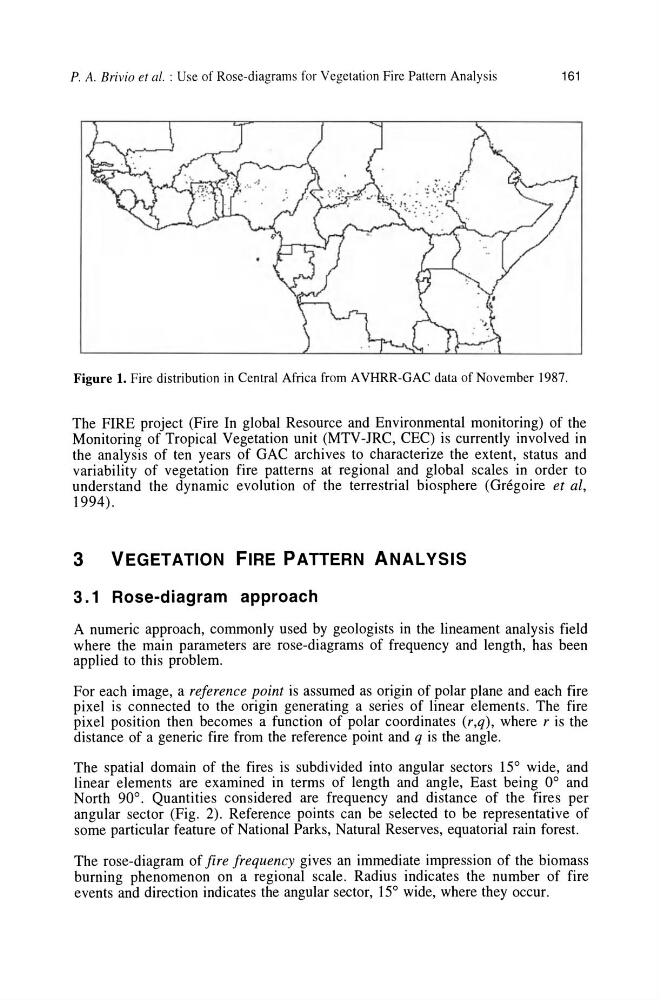
Figure 1. Fire distribution in Central Africa from AVHRR-GAC data of November 1987.
The FIRE project (Fire In global Resource and Environmental monitoring) of the
Monitoring of Tropical Vegetation unit (MTV-JRC, CEC) is currently involved in
the analysis of ten years of GAC archives to characterize the extent, status and
variability of vegetation fire patterns at regional and global scales in order to
understand the dynamic evolution of the terrestrial biosphere (Gregoire et ai,
1994).
3 VEGETATION FIRE PATTERN ANALYSIS
3.1 Rose-diagram approach
A numeric approach, commonly used by geologists in the lineament analysis field
where the main parameters are rose-diagrams of frequency and length, has been
applied to this problem.
For each image, a reference point is assumed as origin of polar plane and each fire
pixel is connected to the origin generating a series of linear elements. The fire
pixel position then becomes a function of polar coordinates (r,q), where r is the
distance of a generic fire from the reference point and q is the angle.
The spatial domain of the fires is subdivided into angular sectors 15° wide, and
linear elements are examined in terms of length and angle, East being 0° and
North 90°. Quantities considered are frequency and distance of the fires per
angular sector (Fig. 2). Reference points can be selected to be representative of
some particular feature of National Parks, Natural Reserves, equatorial rain forest.
The rose-diagram of fire frequency gives an immediate impression of the biomass
burning phenomenon on a regional scale. Radius indicates the number of fire
events and direction indicates the angular sector, 15° wide, where they occur.
161
Figure 1. Fire distribution in Central Africa from AVHRR-GAC data of November 1987.
The FIRE project (Fire In global Resource and Environmental monitoring) of the
Monitoring of Tropical Vegetation unit (MTV-JRC, CEC) is currently involved in
the analysis of ten years of GAC archives to characterize the extent, status and
variability of vegetation fire patterns at regional and global scales in order to
understand the dynamic evolution of the terrestrial biosphere (Gregoire et ai,
1994).
3 VEGETATION FIRE PATTERN ANALYSIS
3.1 Rose-diagram approach
A numeric approach, commonly used by geologists in the lineament analysis field
where the main parameters are rose-diagrams of frequency and length, has been
applied to this problem.
For each image, a reference point is assumed as origin of polar plane and each fire
pixel is connected to the origin generating a series of linear elements. The fire
pixel position then becomes a function of polar coordinates (r,q), where r is the
distance of a generic fire from the reference point and q is the angle.
The spatial domain of the fires is subdivided into angular sectors 15° wide, and
linear elements are examined in terms of length and angle, East being 0° and
North 90°. Quantities considered are frequency and distance of the fires per
angular sector (Fig. 2). Reference points can be selected to be representative of
some particular feature of National Parks, Natural Reserves, equatorial rain forest.
The rose-diagram of fire frequency gives an immediate impression of the biomass
burning phenomenon on a regional scale. Radius indicates the number of fire
events and direction indicates the angular sector, 15° wide, where they occur.