

10. Acoustic Models of Sound Production
433
100 kHz - 675 kHz - ¢
50 kHz - 0
25 kHz - 0
R
L
D
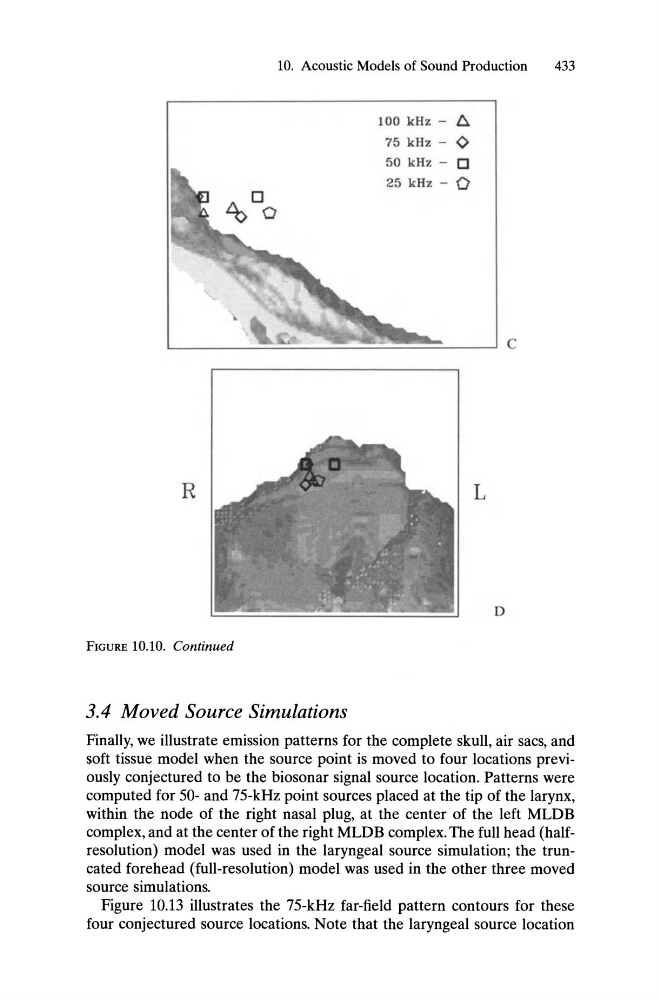
FIGURE 10.10. Continued
3.4 Moved Source Simulations
Finally, we illustrate emission patterns for the complete skull, air sacs, and
~oft tissue model when the source point is moved to four locations previously conjectured to be the biosonar signal source location. Patterns were
computed for 50- and 75-kHz point sources placed at the tip of the larynx,
within the node of the right nasal plug, at the center of the left MLDB
complex, and at the center of the right MLDB complex. The full head (halfresolution) model was used in the laryngeal source simulation; the truncated forehead (full-resolution) model was used in the other three moved
source simulations.
Figure 10.13 illustrates the 75-kHz far-field pattern contours for these
four conjectured source locations. Note that the laryngeal source location
433
100 kHz - 675 kHz - ¢
50 kHz - 0
25 kHz - 0
R
L
D
FIGURE 10.10. Continued
3.4 Moved Source Simulations
Finally, we illustrate emission patterns for the complete skull, air sacs, and
~oft tissue model when the source point is moved to four locations previously conjectured to be the biosonar signal source location. Patterns were
computed for 50- and 75-kHz point sources placed at the tip of the larynx,
within the node of the right nasal plug, at the center of the left MLDB
complex, and at the center of the right MLDB complex. The full head (halfresolution) model was used in the laryngeal source simulation; the truncated forehead (full-resolution) model was used in the other three moved
source simulations.
Figure 10.13 illustrates the 75-kHz far-field pattern contours for these
four conjectured source locations. Note that the laryngeal source location