

432
J.L. Aroyan et al.
A
B
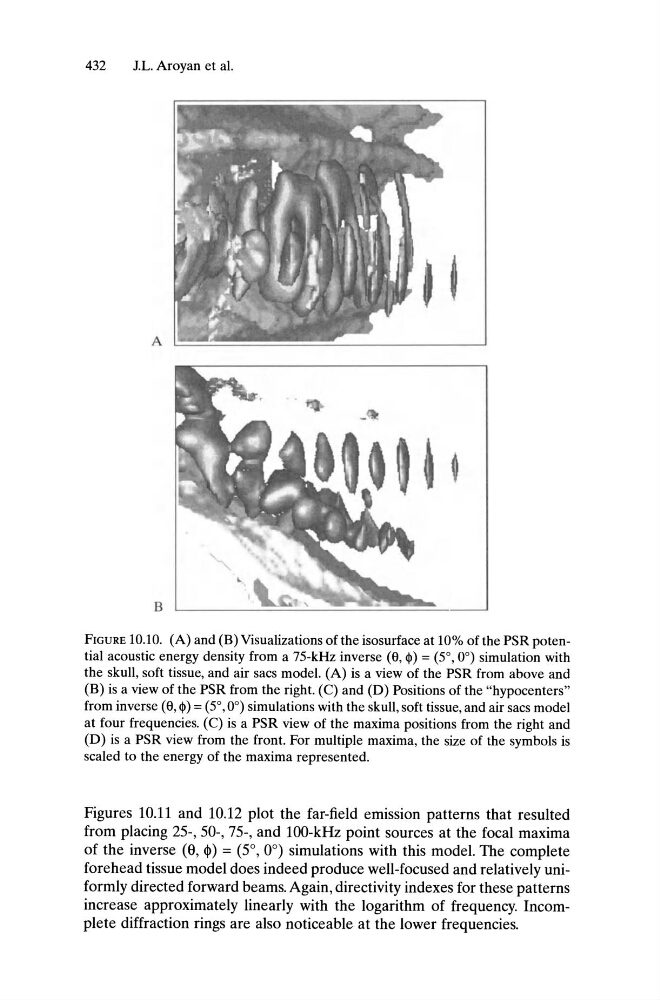
FIGURE 10.10. (A) and (B) Visualizations of the isosurface at 10% of the PSR potential acoustic energy density from a 75-kHz inverse (8, <1» = (5°, 0°) simulation with
the skull, soft tissue, and air sacs model. (A) is a view of the PSR from above and
(B) is a view of the PSR from the right. (C) and (D) Positions of the "hypocenters"
from inverse (8, <1» = (5°,0°) simulations with the skull, soft tissue, and air sacs model
at four frequencies. (C) is a PSR view of the maxima positions from the right and
(D) is a PSR view from the front. For multiple maxima, the size of the symbols is
scaled to the energy of the maxima represented.
Figures 10.11 and 10.12 plot the far-field emission patterns that resulted
from placing 25-, 50-, 75-, and 100-kHz point sources at the focal maxima
of the inverse (8, <\» = (5°,0°) simulations with this model. The complete
forehead tissue model does indeed produce well-focused and relatively uniformly directed forward beams. Again, directivity indexes for these patterns
increase approximately linearly with the logarithm of frequency. Incomplete diffraction rings are also noticeable at the lower frequencies.
J.L. Aroyan et al.
A
B
FIGURE 10.10. (A) and (B) Visualizations of the isosurface at 10% of the PSR potential acoustic energy density from a 75-kHz inverse (8, <1» = (5°, 0°) simulation with
the skull, soft tissue, and air sacs model. (A) is a view of the PSR from above and
(B) is a view of the PSR from the right. (C) and (D) Positions of the "hypocenters"
from inverse (8, <1» = (5°,0°) simulations with the skull, soft tissue, and air sacs model
at four frequencies. (C) is a PSR view of the maxima positions from the right and
(D) is a PSR view from the front. For multiple maxima, the size of the symbols is
scaled to the energy of the maxima represented.
Figures 10.11 and 10.12 plot the far-field emission patterns that resulted
from placing 25-, 50-, 75-, and 100-kHz point sources at the focal maxima
of the inverse (8, <\» = (5°,0°) simulations with this model. The complete
forehead tissue model does indeed produce well-focused and relatively uniformly directed forward beams. Again, directivity indexes for these patterns
increase approximately linearly with the logarithm of frequency. Incomplete diffraction rings are also noticeable at the lower frequencies.