

10. Acoustic Models of Sound Production
431
Skull & Soft TIssue Model
1
0.8
0.6
0.4
0.2
o
(A)
Freq~75kHz; (0.,)=(1.3.-6.8); DI=15.3dB
~-+--f---II:----if--+--l Behind
Below
Above
0.1
0.2
.
0.3 ._.._-_.
0.4 _._._...
0.5 _.._..0.6 _.._._..0.7 ....-_.....
0.8 _.•-_..0 . 9 - -
Behind f-;-+---tR---1-~
(B)
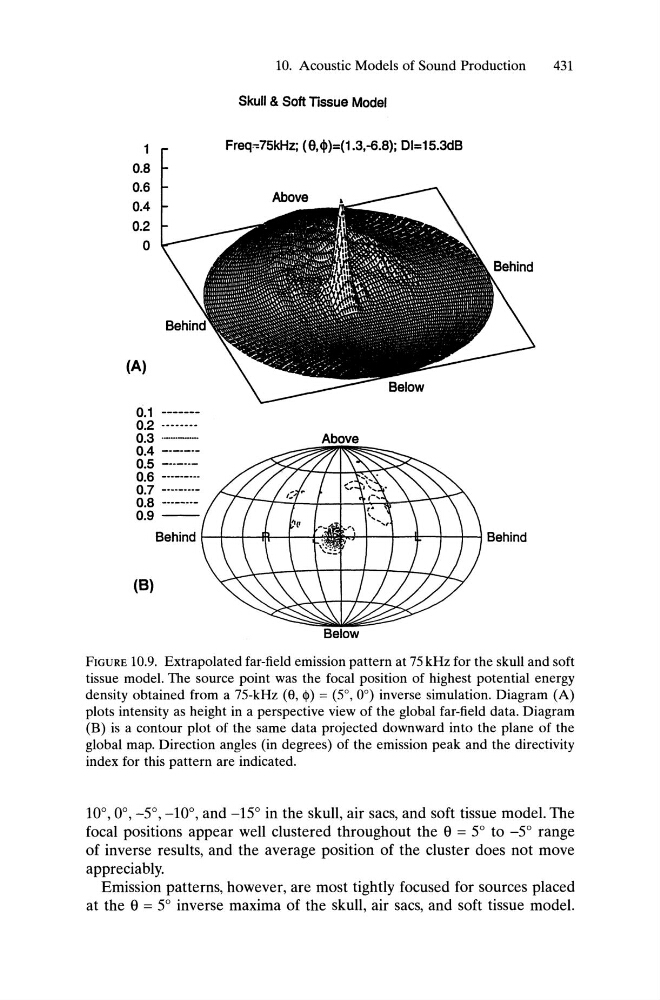
FIGURE 10.9. Extrapolated far-field emission pattern at 75 kHz for the skull and soft
tissue model. The source point was the focal position of highest potential energy
density obtained from a 75-kHz (e, $) = (5°,0°) inverse simulation. Diagram (A)
plots intensity as height in a perspective view of the global far-field data. Diagram
(B) is a contour plot of the same data projected downward into the plane of the
global map. Direction angles (in degrees) of the emission peak and the directivity
index for this pattern are indicated.
10°,0°, _5°, _10°, and -15° in the skull, air sacs, and soft tissue model. The
focal positions appear well clustered throughout the e = 5° to _5° range
of inverse results, and the average position of the cluster does not move
appreciably.
Emission patterns, however, are most tightly focused for sources placed
at the e = 5° inverse maxima of the skull, air sacs, and soft tissue model.
431
Skull & Soft TIssue Model
1
0.8
0.6
0.4
0.2
o
(A)
Freq~75kHz; (0.,)=(1.3.-6.8); DI=15.3dB
~-+--f---II:----if--+--l Behind
Below
Above
0.1
0.2
.
0.3 ._.._-_.
0.4 _._._...
0.5 _.._..0.6 _.._._..0.7 ....-_.....
0.8 _.•-_..0 . 9 - -
Behind f-;-+---tR---1-~
(B)
FIGURE 10.9. Extrapolated far-field emission pattern at 75 kHz for the skull and soft
tissue model. The source point was the focal position of highest potential energy
density obtained from a 75-kHz (e, $) = (5°,0°) inverse simulation. Diagram (A)
plots intensity as height in a perspective view of the global far-field data. Diagram
(B) is a contour plot of the same data projected downward into the plane of the
global map. Direction angles (in degrees) of the emission peak and the directivity
index for this pattern are indicated.
10°,0°, _5°, _10°, and -15° in the skull, air sacs, and soft tissue model. The
focal positions appear well clustered throughout the e = 5° to _5° range
of inverse results, and the average position of the cluster does not move
appreciably.
Emission patterns, however, are most tightly focused for sources placed
at the e = 5° inverse maxima of the skull, air sacs, and soft tissue model.