

428
J.L. Aroyan et al.
A
B
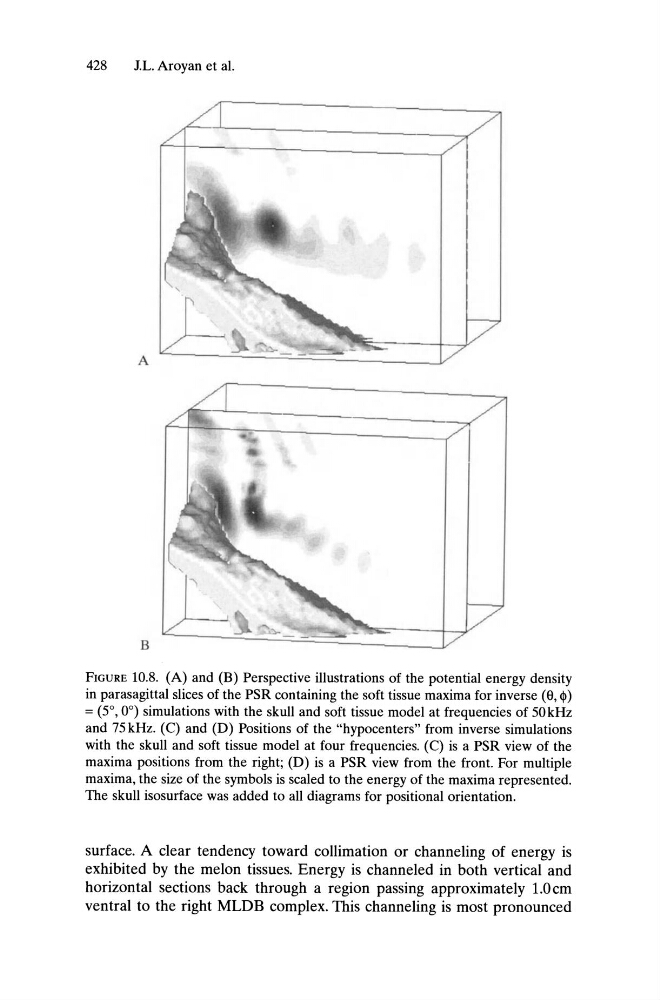
FIGURE 10.8. (A) and (B) Perspective illustrations of the potential energy density
in parasagittal slices of the PSR containing the soft tissue maxima for inverse (8, $)
= (5°,0°) simulations with the skull and soft tissue model at frequencies of 50kHz
and 75 kHz. (C) and (D) Positions of the "hypocenters" from inverse simulations
with the skull and soft tissue model at four frequencies. (C) is a PSR view of the
maxima positions from the right; (D) is a PSR view from the front. For multiple
maxima, the size of the symbols is scaled to the energy of the maxima represented.
The skull isosurface was added to all diagrams for positional orientation.
surface. A clear tendency toward collimation or channeling of energy is
exhibited by the melon tissues. Energy is channeled in both vertical and
horizontal sections back through a region passing approximately 1.0cm
ventral to the right MLDB complex. This channeling is most pronounced
J.L. Aroyan et al.
A
B
FIGURE 10.8. (A) and (B) Perspective illustrations of the potential energy density
in parasagittal slices of the PSR containing the soft tissue maxima for inverse (8, $)
= (5°,0°) simulations with the skull and soft tissue model at frequencies of 50kHz
and 75 kHz. (C) and (D) Positions of the "hypocenters" from inverse simulations
with the skull and soft tissue model at four frequencies. (C) is a PSR view of the
maxima positions from the right; (D) is a PSR view from the front. For multiple
maxima, the size of the symbols is scaled to the energy of the maxima represented.
The skull isosurface was added to all diagrams for positional orientation.
surface. A clear tendency toward collimation or channeling of energy is
exhibited by the melon tissues. Energy is channeled in both vertical and
horizontal sections back through a region passing approximately 1.0cm
ventral to the right MLDB complex. This channeling is most pronounced