

10. Acoustic Models of Sound Production
427
1
0.8
0.6
0.4
0.2
o
(A)
Skull Model
Freq=75kHz; (e.~)=(6.8.4.1); DI=12.4dB
Below
Above
0.1
0.2
.
0.3 .._ _.0.4 -'-'-'0.5 -"-"0.6 _..•.•...
0.7 _..._...0.8 -"--"0 . 9 - -
Behind t-t-+--llt~~+f~~tt--+---ll:--+--J--I Behind
(B)
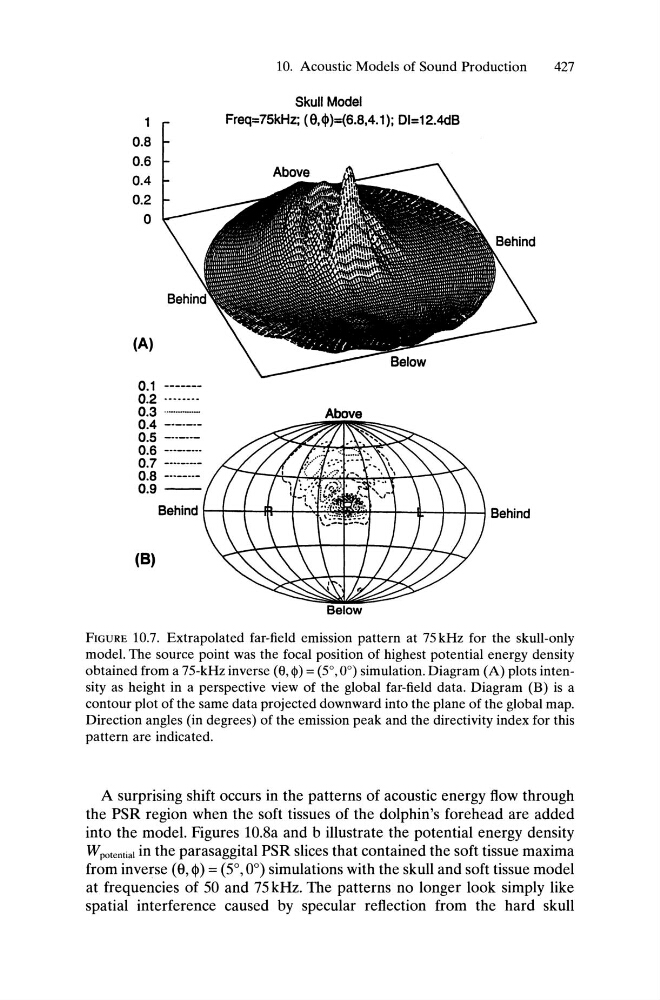
FIGURE 10.7. Extrapolated far-field emission pattern at 75 kHz for the skull-only
model. The source point was the focal position of highest potential energy density
obtained from a 75-kHz inverse (8, <1» = (5°,0°) simulation. Diagram (A) plots intensity as height in a perspective view of the global far-field data. Diagram (B) is a
contour plot of the same data projected downward into the plane of the global map.
Direction angles (in degrees) of the emission peak and the directivity index for this
pattern are indicated.
A surprising shift occurs in the patterns of acoustic energy flow through
the PSR region when the soft tissues of the dolphin's forehead are added
into the model. Figures lO.8a and b illustrate the potential energy density
Wpotential in the parasaggital PSR slices that contained the soft tissue maxima
from inverse (e, ~) = (5°,0°) simulations with the skull and soft tissue model
at frequencies of 50 and 75 kHz. The patterns no longer look simply like
spatial interference caused by specular reflection from the hard skull
427
1
0.8
0.6
0.4
0.2
o
(A)
Skull Model
Freq=75kHz; (e.~)=(6.8.4.1); DI=12.4dB
Below
Above
0.1
0.2
.
0.3 .._ _.0.4 -'-'-'0.5 -"-"0.6 _..•.•...
0.7 _..._...0.8 -"--"0 . 9 - -
Behind t-t-+--llt~~+f~~tt--+---ll:--+--J--I Behind
(B)
FIGURE 10.7. Extrapolated far-field emission pattern at 75 kHz for the skull-only
model. The source point was the focal position of highest potential energy density
obtained from a 75-kHz inverse (8, <1» = (5°,0°) simulation. Diagram (A) plots intensity as height in a perspective view of the global far-field data. Diagram (B) is a
contour plot of the same data projected downward into the plane of the global map.
Direction angles (in degrees) of the emission peak and the directivity index for this
pattern are indicated.
A surprising shift occurs in the patterns of acoustic energy flow through
the PSR region when the soft tissues of the dolphin's forehead are added
into the model. Figures lO.8a and b illustrate the potential energy density
Wpotential in the parasaggital PSR slices that contained the soft tissue maxima
from inverse (e, ~) = (5°,0°) simulations with the skull and soft tissue model
at frequencies of 50 and 75 kHz. The patterns no longer look simply like
spatial interference caused by specular reflection from the hard skull