

o
o
10. Acoustic Models of Sound Production
429
100 kHz - l::J.
75 kHz - <>
50 kHz - CI
25 kHz - 0
o
R
L
o
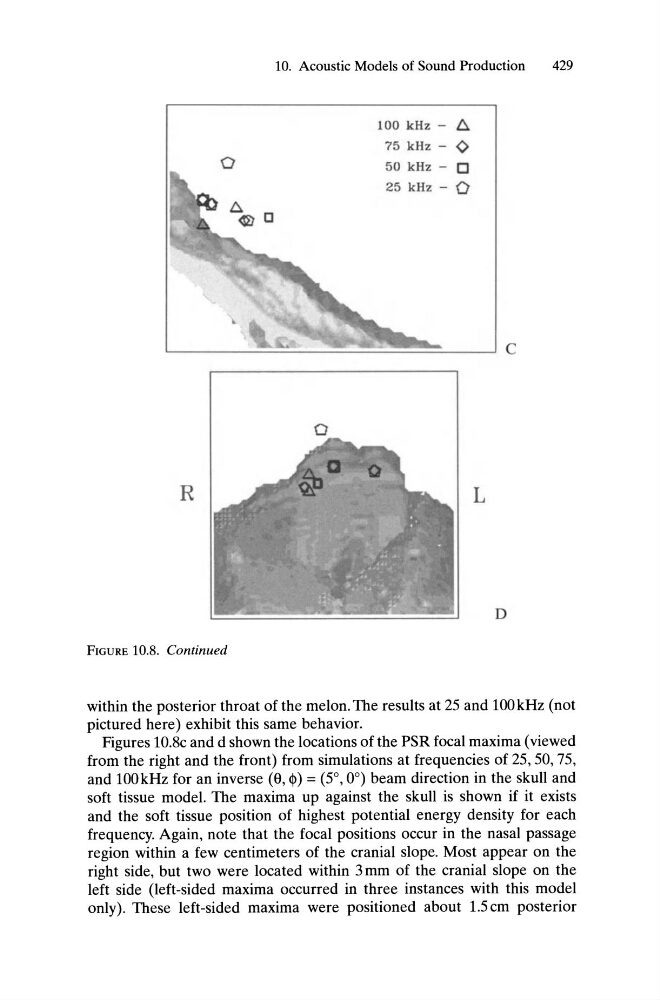
FIGURE 10.8. Continued
within the posterior throat of the melon. The results at 25 and 100kHz (not
pictured here) exhibit this same behavior.
Figures 1O.8c and d shown the locations of the PSR focal maxima (viewed
from the right and the front) from simulations at frequencies of 25, 50, 75,
and 100kHz for an inverse (e, <1» = (5°,0°) beam direction in the skull and
soft tissue model. The maxima up against the skull is shown if it exists
and the soft tissue position of highest potential energy density for each
frequency. Again, note that the focal positions occur in the nasal passage
region within a few centimeters of the cranial slope. Most appear on the
right side, but two were located within 3 mm of the cranial slope on the
left side (left-sided maxima occurred in three instances with this model
only). These left-sided maxima were positioned about 1.5 cm posterior
o
10. Acoustic Models of Sound Production
429
100 kHz - l::J.
75 kHz - <>
50 kHz - CI
25 kHz - 0
o
R
L
o
FIGURE 10.8. Continued
within the posterior throat of the melon. The results at 25 and 100kHz (not
pictured here) exhibit this same behavior.
Figures 1O.8c and d shown the locations of the PSR focal maxima (viewed
from the right and the front) from simulations at frequencies of 25, 50, 75,
and 100kHz for an inverse (e, <1» = (5°,0°) beam direction in the skull and
soft tissue model. The maxima up against the skull is shown if it exists
and the soft tissue position of highest potential energy density for each
frequency. Again, note that the focal positions occur in the nasal passage
region within a few centimeters of the cranial slope. Most appear on the
right side, but two were located within 3 mm of the cranial slope on the
left side (left-sided maxima occurred in three instances with this model
only). These left-sided maxima were positioned about 1.5 cm posterior