

424
IL. Aroyan et al.
negative x-axis, which corresponds (via reciprocity) to a forward beam
direction of 5° above the positive x-axis. Recall the logic of the inverse procedure: the maxima produced by a return beam will correspond to those
positions within the tissue model that could, were sources placed there, best
A
B
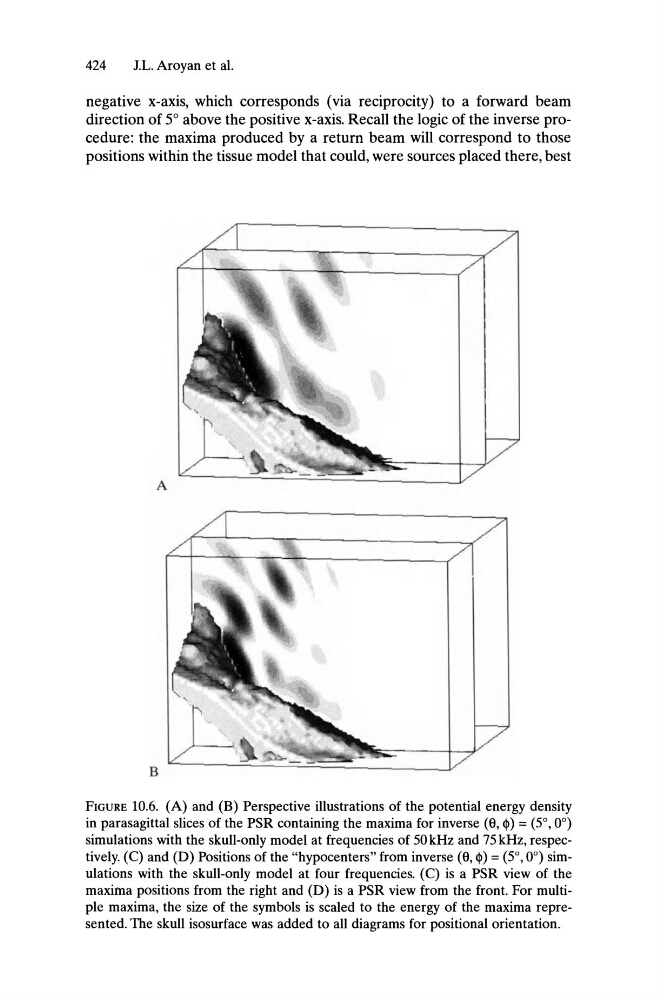
FIGURE 10.6. (A) and (B) Perspective illustrations of the potential energy density
in parasagittal slices of the PSR containing the maxima for inverse (e, $) = (5°,0°)
simulations with the skull-only model at frequencies of 50kHz and 75kHz, respectively. (C) and (D) Positions of the "hypocenters" from inverse (e, $) = (5°,0°) simulations with the skull-only model at four frequencies. (C) is a PSR view of the
maxima positions from the right and (D) is a PSR view from the front. For multiple maxima, the size of the symbols is scaled to the energy of the maxima represented. The skull isosurface was added to all diagrams for positional orientation.
IL. Aroyan et al.
negative x-axis, which corresponds (via reciprocity) to a forward beam
direction of 5° above the positive x-axis. Recall the logic of the inverse procedure: the maxima produced by a return beam will correspond to those
positions within the tissue model that could, were sources placed there, best
A
B
FIGURE 10.6. (A) and (B) Perspective illustrations of the potential energy density
in parasagittal slices of the PSR containing the maxima for inverse (e, $) = (5°,0°)
simulations with the skull-only model at frequencies of 50kHz and 75kHz, respectively. (C) and (D) Positions of the "hypocenters" from inverse (e, $) = (5°,0°) simulations with the skull-only model at four frequencies. (C) is a PSR view of the
maxima positions from the right and (D) is a PSR view from the front. For multiple maxima, the size of the symbols is scaled to the energy of the maxima represented. The skull isosurface was added to all diagrams for positional orientation.