

Ti ue
model
region
A
Porlion of righ l vesli bular sac
B
Right MLDB complex
Mel n core
Connective li ue th ca
around posterior throat
of melon
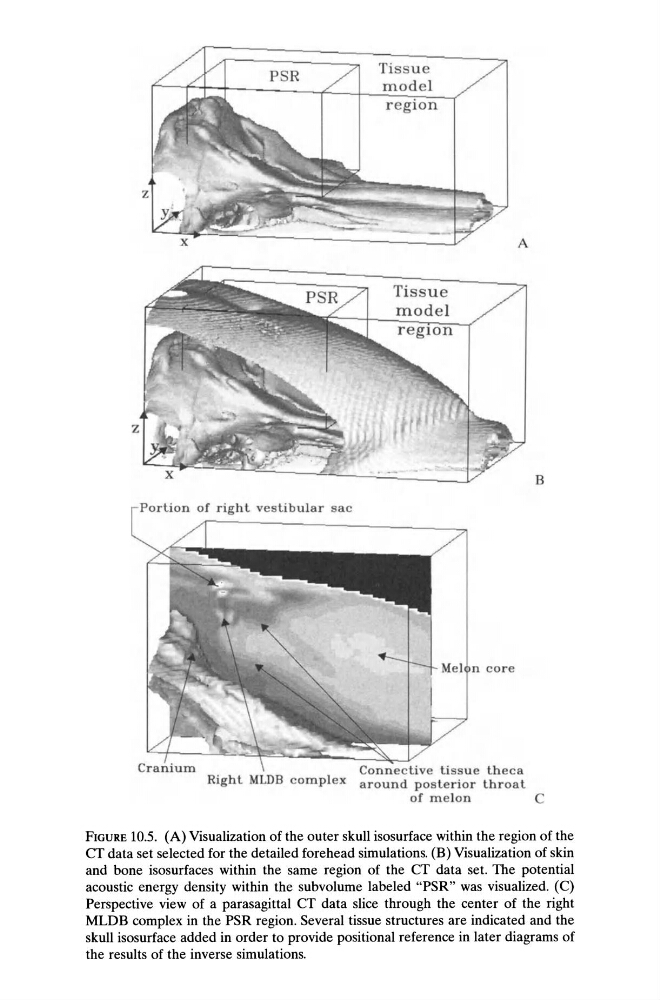
FIGURE 10.5. (A) Visualization of the outer skull isosurface within the region of the
cr data set selected for the detailed forehead simulations. (B) Visualization of skin
and bone isosurfaces within the same region of the cr data set. The potential
acoustic energy density within the subvolume labeled "PSR" was visualized. (C)
Perspective view of a parasagittal cr data slice through the center of the right
MLDB complex in the PSR region. Several tissue structures are indicated and the
skull isosurface added in order to provide positional reference in later diagrams of
the results of the inverse simulations.
model
region
A
Porlion of righ l vesli bular sac
B
Right MLDB complex
Mel n core
Connective li ue th ca
around posterior throat
of melon
FIGURE 10.5. (A) Visualization of the outer skull isosurface within the region of the
cr data set selected for the detailed forehead simulations. (B) Visualization of skin
and bone isosurfaces within the same region of the cr data set. The potential
acoustic energy density within the subvolume labeled "PSR" was visualized. (C)
Perspective view of a parasagittal cr data slice through the center of the right
MLDB complex in the PSR region. Several tissue structures are indicated and the
skull isosurface added in order to provide positional reference in later diagrams of
the results of the inverse simulations.