

10. Acoustic Models of Sound Production
425
a
100 kHz - l:::i.
75 kHz - <>
50 kHz - 0
25 kHz - 0
c
R
L
D
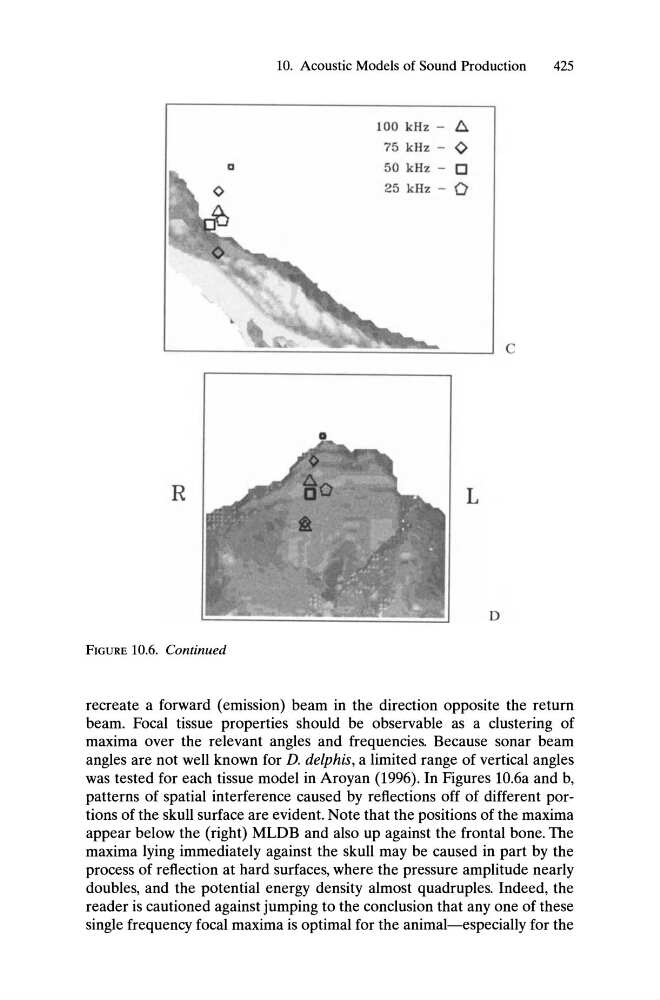
FIGURE 10.6. Continued
recreate a forward (emission) beam in the direction opposite the return
beam. Focal tissue properties should be observable as a clustering of
maxima over the relevant angles and frequencies. Because sonar beam
angles are not well known for D. de/phis, a limited range of vertical angles
was tested for each tissue model in Aroyan (1996). In Figures 10.6a and b,
patterns of spatial interference caused by reflections off of different portions of the skull surface are evident. Note that the positions of the maxima
appear below the (right) MLDB and also up against the frontal bone. The
maxima lying immediately against the skull may be caused in part by the
process of reflection at hard surfaces, where the pressure amplitude nearly
doubles, and the potential energy density almost quadruples. Indeed, the
reader is cautioned against jumping to the conclusion that anyone of these
single frequency focal maxima is optimal for the animal-especially for the
425
a
100 kHz - l:::i.
75 kHz - <>
50 kHz - 0
25 kHz - 0
c
R
L
D
FIGURE 10.6. Continued
recreate a forward (emission) beam in the direction opposite the return
beam. Focal tissue properties should be observable as a clustering of
maxima over the relevant angles and frequencies. Because sonar beam
angles are not well known for D. de/phis, a limited range of vertical angles
was tested for each tissue model in Aroyan (1996). In Figures 10.6a and b,
patterns of spatial interference caused by reflections off of different portions of the skull surface are evident. Note that the positions of the maxima
appear below the (right) MLDB and also up against the frontal bone. The
maxima lying immediately against the skull may be caused in part by the
process of reflection at hard surfaces, where the pressure amplitude nearly
doubles, and the potential energy density almost quadruples. Indeed, the
reader is cautioned against jumping to the conclusion that anyone of these
single frequency focal maxima is optimal for the animal-especially for the