

9. Echolocation in Dolphins
397
STANDARD
2!50 jls
2!50 jls
200
iOO
--111.4 kHz
a
m a
0
UJ
0
:::J -20
~
H
..J
n.
X
« -~
a
I
2!50 jls
FREQUENCY (KHZ)
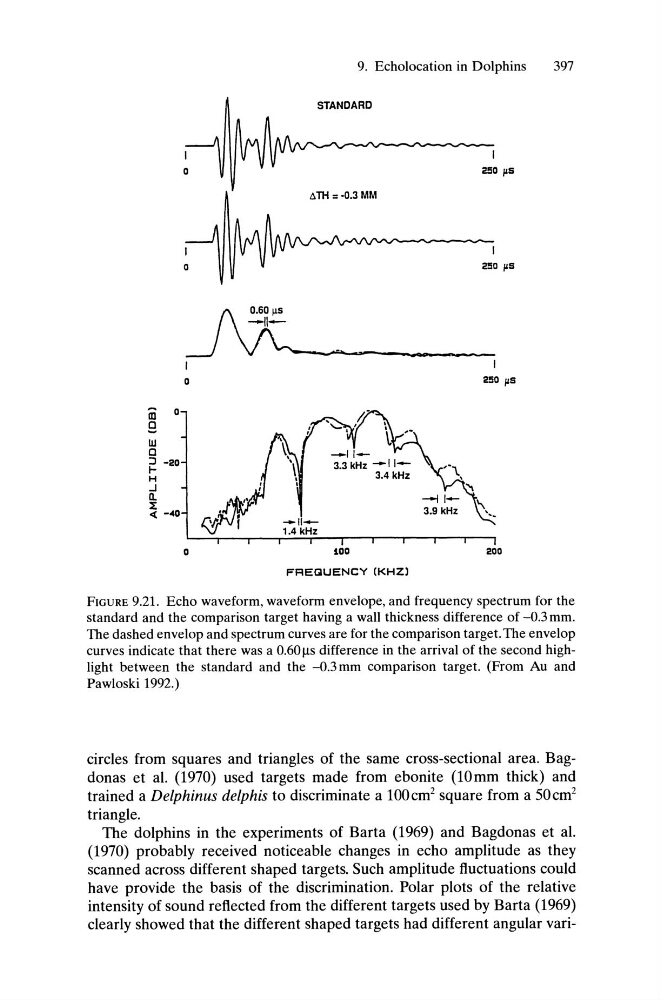
FIGURE 9.21. Echo waveform, waveform envelope, and frequency spectrum for the
standard and the comparison target having a wall thickness difference of -0.3 mm.
The dashed envelop and spectrum curves are for the comparison target. The envelop
curves indicate that there was a O.60~s difference in the arrival of the second highlight between the standard and the -0.3 mm comparison target. (From Au and
Pawloski 1992.)
circles from squares and triangles of the same cross-sectional area. Bagdonas et at. (1970) used targets made from ebonite (lOmm thick) and
trained a Delphinus delphis to discriminate a 100cm
2
square from a 50cm
2
triangle.
The dolphins in the experiments of Barta (1969) and Bagdonas et al.
(1970) probably received noticeable changes in echo amplitude as they
scanned across different shaped targets. Such amplitude fluctuations could
have provide the basis of the discrimination. Polar plots of the relative
intensity of sound reflected from the different targets used by Barta (1969)
clearly showed that the different shaped targets had different angular vari-
397
STANDARD
2!50 jls
2!50 jls
200
iOO
--111.4 kHz
a
m a
0
UJ
0
:::J -20
~
H
..J
n.
X
« -~
a
I
2!50 jls
FREQUENCY (KHZ)
FIGURE 9.21. Echo waveform, waveform envelope, and frequency spectrum for the
standard and the comparison target having a wall thickness difference of -0.3 mm.
The dashed envelop and spectrum curves are for the comparison target. The envelop
curves indicate that there was a O.60~s difference in the arrival of the second highlight between the standard and the -0.3 mm comparison target. (From Au and
Pawloski 1992.)
circles from squares and triangles of the same cross-sectional area. Bagdonas et at. (1970) used targets made from ebonite (lOmm thick) and
trained a Delphinus delphis to discriminate a 100cm
2
square from a 50cm
2
triangle.
The dolphins in the experiments of Barta (1969) and Bagdonas et al.
(1970) probably received noticeable changes in echo amplitude as they
scanned across different shaped targets. Such amplitude fluctuations could
have provide the basis of the discrimination. Polar plots of the relative
intensity of sound reflected from the different targets used by Barta (1969)
clearly showed that the different shaped targets had different angular vari-