

396
W.W.L.Au
PERCENT
CORRECT
100
80
60
THINNER
THICKER
40
20
-0.6
-0.4
-0.2
0.6
0.8
WAll THICKNESS DIFFERENCE (mm)
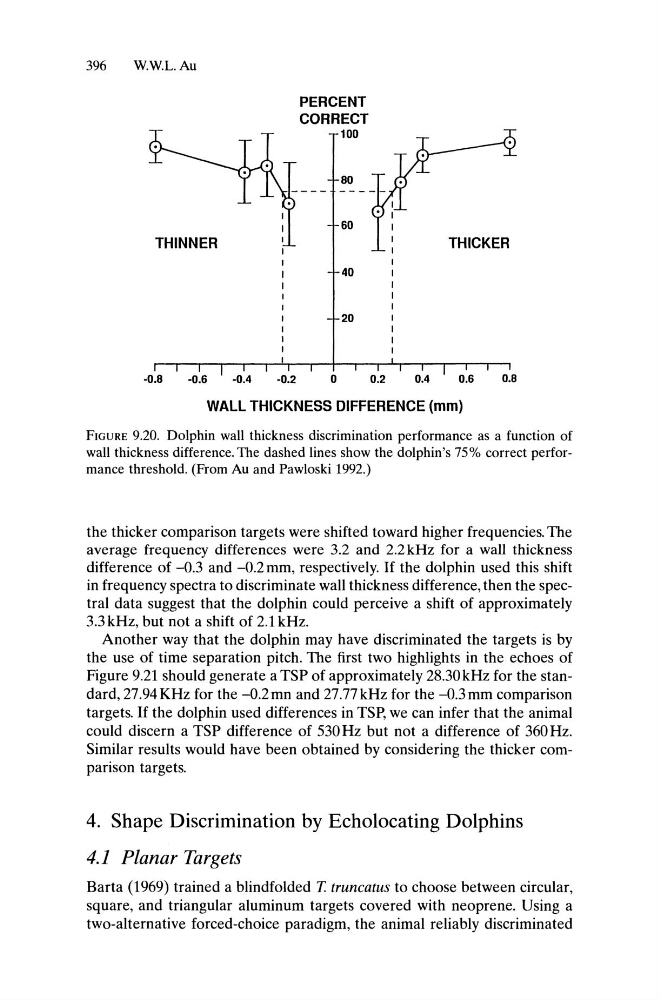
FIGURE 9.20. Dolphin wall thickness discrimination performance as a function of
wall thickness difference. The dashed lines show the dolphin's 75% correct performance threshold. (From Au and Pawloski 1992.)
the thicker comparison targets were shifted toward higher frequencies. The
average frequency differences were 3.2 and 2.2 kHz for a wall thickness
difference of -0.3 and -0.2 mm, respectively. If the dolphin used this shift
in frequency spectra to discriminate wall thickness difference, then the spectral data suggest that the dolphin could perceive a shift of approximately
3.3 kHz, but not a shift of 2.1 kHz.
Another way that the dolphin may have discriminated the targets is by
the use of time separation pitch. The first two highlights in the echoes of
Figure 9.21 should generate a TSP of approximately 28.30 kHz for the standard, 27.94 KHz for the -0.2 mn and 27.77 kHz for the -0.3 mm comparison
targets. If the dolphin used differences in TSp, we can infer that the animal
could discern a TSP difference of 530 Hz but not a difference of 360 Hz.
Similar results would have been obtained by considering the thicker comparison targets.
4. Shape Discrimination by Echolocating Dolphins
4.1 Planar Targets
Barta (1969) trained a blindfolded T truncatus to choose between circular,
square, and triangular aluminum targets covered with neoprene. Using a
two-alternative forced-choice paradigm, the animal reliably discriminated
W.W.L.Au
PERCENT
CORRECT
100
80
60
THINNER
THICKER
40
20
-0.6
-0.4
-0.2
0.6
0.8
WAll THICKNESS DIFFERENCE (mm)
FIGURE 9.20. Dolphin wall thickness discrimination performance as a function of
wall thickness difference. The dashed lines show the dolphin's 75% correct performance threshold. (From Au and Pawloski 1992.)
the thicker comparison targets were shifted toward higher frequencies. The
average frequency differences were 3.2 and 2.2 kHz for a wall thickness
difference of -0.3 and -0.2 mm, respectively. If the dolphin used this shift
in frequency spectra to discriminate wall thickness difference, then the spectral data suggest that the dolphin could perceive a shift of approximately
3.3 kHz, but not a shift of 2.1 kHz.
Another way that the dolphin may have discriminated the targets is by
the use of time separation pitch. The first two highlights in the echoes of
Figure 9.21 should generate a TSP of approximately 28.30 kHz for the standard, 27.94 KHz for the -0.2 mn and 27.77 kHz for the -0.3 mm comparison
targets. If the dolphin used differences in TSp, we can infer that the animal
could discern a TSP difference of 530 Hz but not a difference of 360 Hz.
Similar results would have been obtained by considering the thicker comparison targets.
4. Shape Discrimination by Echolocating Dolphins
4.1 Planar Targets
Barta (1969) trained a blindfolded T truncatus to choose between circular,
square, and triangular aluminum targets covered with neoprene. Using a
two-alternative forced-choice paradigm, the animal reliably discriminated