

9. Echolocation in Dolphins
381
100
-- 90
~
0
~
w
en 80
Z
0
o AU & PENNER (1981) - Heptuna
a.
en
UJ
70
•
- Ehiku
a:
ls AU et al. (1988)
U
A TURL et al. (1987)
16.5 m
UJ
60
a:
a:
...
40.0 m
0
U
50
w
80.0 m
-5
o
5
10
15
20
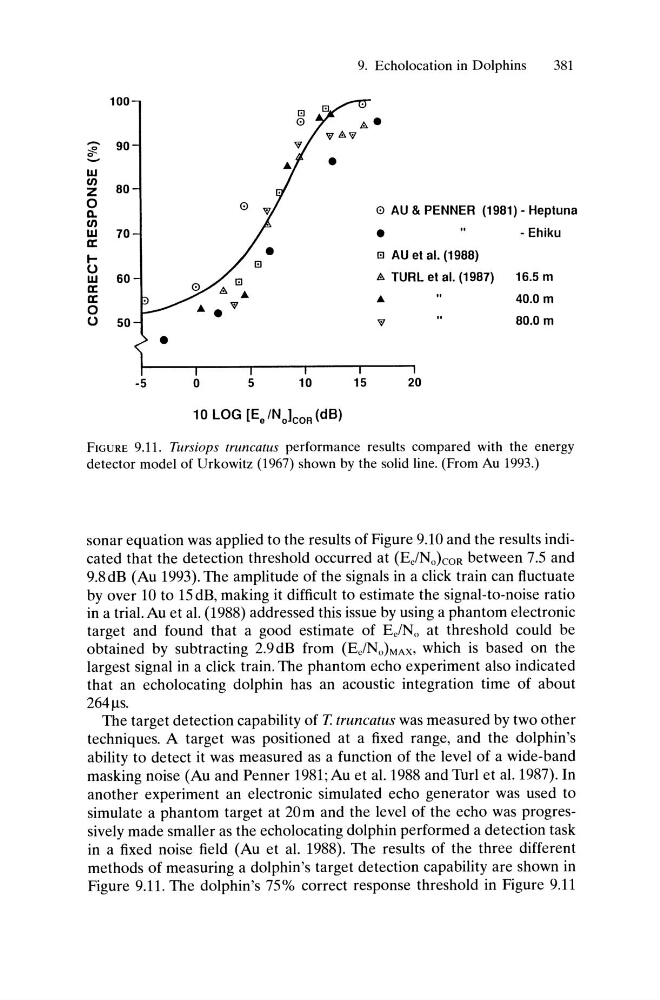
FIGURE 9.11. Tursiops lruncalus performance results compared with the energy
detector model of Urkowitz (1967) shown by the solid line. (From Au 1993.)
sonar equation was applied to the results of Figure 9.10 and the results indicated that the detection threshold occurred at (Ee/NokoR between 7.5 and
9.8dB (Au 1993). The amplitude of the signals in a click train can fluctuate
by over 10 to 15 dB, making it difficult to estimate the signal-to-noise ratio
in a trial. Au et al. (1988) addressed this issue by using a phantom electronic
target and found that a good estimate of EelN o at threshold could be
obtained by subtracting 2.9dB from (EelNo)MAX' which is based on the
largest signal in a click train. The phantom echo experiment also indicated
that an echolocating dolphin has an acoustic integration time of about
264Jls.
The target detection capability of T truncatus was measured by two other
techniques. A target was positioned at a fixed range, and the dolphin's
ability to detect it was measured as a function of the level of a wide-band
masking noise (Au and Penner 1981; Au et al. 1988 and Turl et al. 1987). In
another experiment an electronic simulated echo generator was used to
simulate a phantom target at 20m and the level of the echo was progressively made smaller as the echolocating dolphin performed a detection task
in a fixed noise field (Au et al. 1988). The results of the three different
methods of measuring a dolphin's target detection capability are shown in
Figure 9.11. The dolphin's 75% correct response threshold in Figure 9.11
381
100
-- 90
~
0
~
w
en 80
Z
0
o AU & PENNER (1981) - Heptuna
a.
en
UJ
70
•
- Ehiku
a:
ls AU et al. (1988)
U
A TURL et al. (1987)
16.5 m
UJ
60
a:
a:
...
40.0 m
0
U
50
w
80.0 m
-5
o
5
10
15
20
FIGURE 9.11. Tursiops lruncalus performance results compared with the energy
detector model of Urkowitz (1967) shown by the solid line. (From Au 1993.)
sonar equation was applied to the results of Figure 9.10 and the results indicated that the detection threshold occurred at (Ee/NokoR between 7.5 and
9.8dB (Au 1993). The amplitude of the signals in a click train can fluctuate
by over 10 to 15 dB, making it difficult to estimate the signal-to-noise ratio
in a trial. Au et al. (1988) addressed this issue by using a phantom electronic
target and found that a good estimate of EelN o at threshold could be
obtained by subtracting 2.9dB from (EelNo)MAX' which is based on the
largest signal in a click train. The phantom echo experiment also indicated
that an echolocating dolphin has an acoustic integration time of about
264Jls.
The target detection capability of T truncatus was measured by two other
techniques. A target was positioned at a fixed range, and the dolphin's
ability to detect it was measured as a function of the level of a wide-band
masking noise (Au and Penner 1981; Au et al. 1988 and Turl et al. 1987). In
another experiment an electronic simulated echo generator was used to
simulate a phantom target at 20m and the level of the echo was progressively made smaller as the echolocating dolphin performed a detection task
in a fixed noise field (Au et al. 1988). The results of the three different
methods of measuring a dolphin's target detection capability are shown in
Figure 9.11. The dolphin's 75% correct response threshold in Figure 9.11