

382
w.w.L. Au
E/N =7.5 dB
0-150 kHz
o
E/N = 7.5 dB
75 - 150 kHz
1 ms
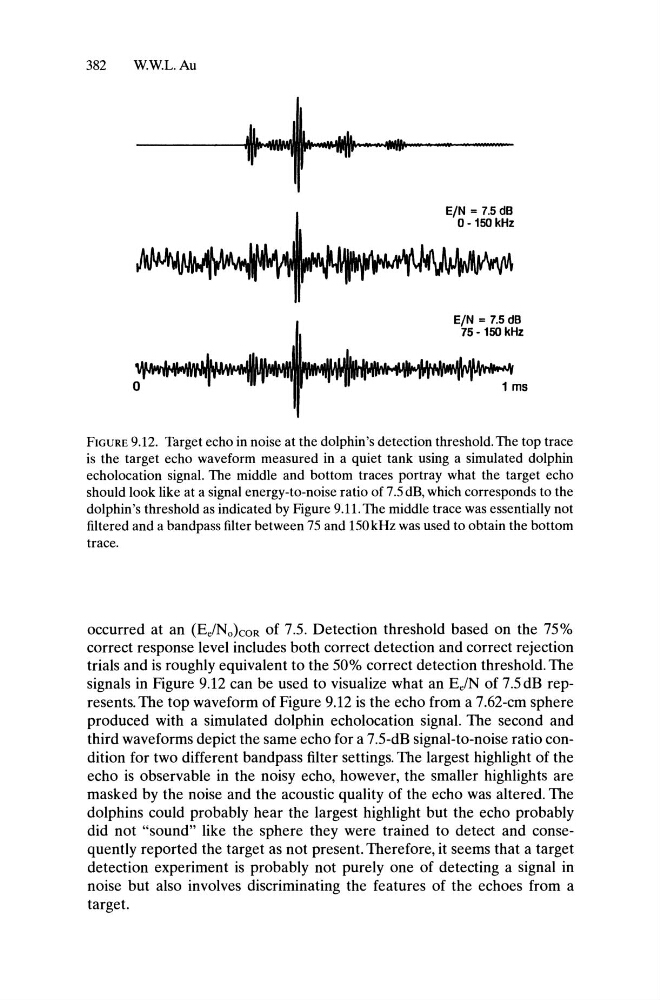
FIGURE 9.12. Target echo in noise at the dolphin's detection threshold. The top trace
is the target echo waveform measured in a quiet tank using a simulated dolphin
echolocation signal. The middle and bottom traces portray what the target echo
should look like at a signal energy-to-noise ratio of 7.5 dB, which corresponds to the
dolphin's threshold as indicated by Figure 9.11. The middle trace was essentially not
filtered and a bandpass filter between 75 and 150kHz was used to obtain the bottom
trace.
occurred at an (Ee/NokoR of 7.5. Detection threshold based on the 75%
correct response level includes both correct detection and correct rejection
trials and is roughly equivalent to the 50% correct detection threshold. The
signals in Figure 9.12 can be used to visualize what an EelN of 7.5dB represents. The top waveform of Figure 9.12 is the echo from a 7.62-cm sphere
produced with a simulated dolphin echolocation signal. The second and
third waveforms depict the same echo for a 7.5-dB signal-to-noise ratio condition for two different bandpass filter settings. The largest highlight of the
echo is observable in the noisy echo, however, the smaller highlights are
masked by the noise and the acoustic quality of the echo was altered. The
dolphins could probably hear the largest highlight but the echo probably
did not "sound" like the sphere they were trained to detect and consequently reported the target as not present. Therefore, it seems that a target
detection experiment is probably not purely one of detecting a signal in
noise but also involves discriminating the features of the echoes from a
target.
w.w.L. Au
E/N =7.5 dB
0-150 kHz
o
E/N = 7.5 dB
75 - 150 kHz
1 ms
FIGURE 9.12. Target echo in noise at the dolphin's detection threshold. The top trace
is the target echo waveform measured in a quiet tank using a simulated dolphin
echolocation signal. The middle and bottom traces portray what the target echo
should look like at a signal energy-to-noise ratio of 7.5 dB, which corresponds to the
dolphin's threshold as indicated by Figure 9.11. The middle trace was essentially not
filtered and a bandpass filter between 75 and 150kHz was used to obtain the bottom
trace.
occurred at an (Ee/NokoR of 7.5. Detection threshold based on the 75%
correct response level includes both correct detection and correct rejection
trials and is roughly equivalent to the 50% correct detection threshold. The
signals in Figure 9.12 can be used to visualize what an EelN of 7.5dB represents. The top waveform of Figure 9.12 is the echo from a 7.62-cm sphere
produced with a simulated dolphin echolocation signal. The second and
third waveforms depict the same echo for a 7.5-dB signal-to-noise ratio condition for two different bandpass filter settings. The largest highlight of the
echo is observable in the noisy echo, however, the smaller highlights are
masked by the noise and the acoustic quality of the echo was altered. The
dolphins could probably hear the largest highlight but the echo probably
did not "sound" like the sphere they were trained to detect and consequently reported the target as not present. Therefore, it seems that a target
detection experiment is probably not purely one of detecting a signal in
noise but also involves discriminating the features of the echoes from a
target.