

380
w.w.L. Au
2.54-cm SPHERE
MURCHISON (1980)
120
100
CORRECT DETECTION
;1' .
FALSE ALARM .f;!/
I
A~ __b---A..
,fir-~
....... "
70 t 80 90
73
TARGET RANGE (M)
60
50
FALSE ALARM
A. ....................
100
20
80
~ 60
z
c(
:::E
a:
o
l:: 40
w
Q.
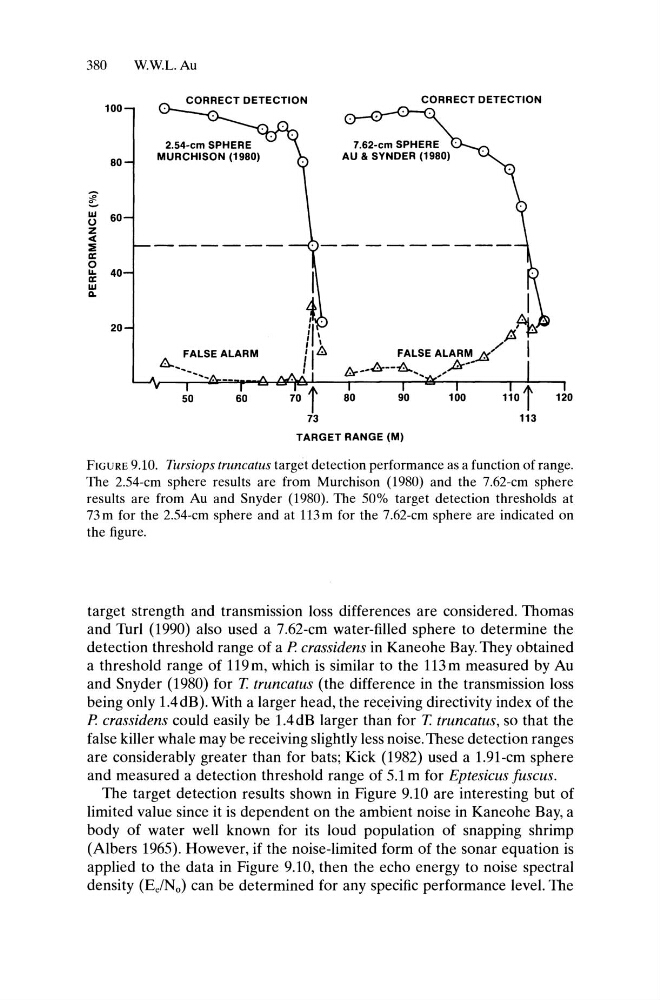
FIGURE 9.10. Tursiops truncatus target detection performance as a function ofrange.
The 2.54-cm sphere results are from Murchison (1980) and the 7.62-cm sphere
results are from Au and Snyder (1980). The 50% target detection thresholds at
73 m for the 2.54-cm sphere and at 113 m for the 7.62-cm sphere are indicated on
the figure.
target strength and transmission loss differences are considered. Thomas
and Turl (1990) also used a 7.62-cm water-filled sphere to determine the
detection threshold range of a P crassidens in Kaneohe Bay. They obtained
a threshold range of 119m, which is similar to the 113m measured by Au
and Snyder (1980) for T. truncatus (the difference in the transmission loss
being only l.4dB). With a larger head, the receiving directivity index of the
P crassidens could easily be l.4dB larger than for T. truncatus, so that the
false killer whale may be receiving slightly less noise. These detection ranges
are considerably greater than for bats; Kick (1982) used a 1.91-cm sphere
and measured a detection threshold range of 5.1 m for Eptesicus fuscus.
The target detection results shown in Figure 9.10 are interesting but of
limited value since it is dependent on the ambient noise in Kaneohe Bay, a
body of water well known for its loud population of snapping shrimp
(Albers 1965). However, if the noise-limited form of the sonar equation is
applied to the data in Figure 9.10, then the echo energy to noise spectral
density (Ee/N o ) can be determined for any specific performance level. The
w.w.L. Au
2.54-cm SPHERE
MURCHISON (1980)
120
100
CORRECT DETECTION
;1' .
FALSE ALARM .f;!/
I
A~ __b---A..
,fir-~
....... "
70 t 80 90
73
TARGET RANGE (M)
60
50
FALSE ALARM
A. ....................
100
20
80
~ 60
z
c(
:::E
a:
o
l:: 40
w
Q.
FIGURE 9.10. Tursiops truncatus target detection performance as a function ofrange.
The 2.54-cm sphere results are from Murchison (1980) and the 7.62-cm sphere
results are from Au and Snyder (1980). The 50% target detection thresholds at
73 m for the 2.54-cm sphere and at 113 m for the 7.62-cm sphere are indicated on
the figure.
target strength and transmission loss differences are considered. Thomas
and Turl (1990) also used a 7.62-cm water-filled sphere to determine the
detection threshold range of a P crassidens in Kaneohe Bay. They obtained
a threshold range of 119m, which is similar to the 113m measured by Au
and Snyder (1980) for T. truncatus (the difference in the transmission loss
being only l.4dB). With a larger head, the receiving directivity index of the
P crassidens could easily be l.4dB larger than for T. truncatus, so that the
false killer whale may be receiving slightly less noise. These detection ranges
are considerably greater than for bats; Kick (1982) used a 1.91-cm sphere
and measured a detection threshold range of 5.1 m for Eptesicus fuscus.
The target detection results shown in Figure 9.10 are interesting but of
limited value since it is dependent on the ambient noise in Kaneohe Bay, a
body of water well known for its loud population of snapping shrimp
(Albers 1965). However, if the noise-limited form of the sonar equation is
applied to the data in Figure 9.10, then the echo energy to noise spectral
density (Ee/N o ) can be determined for any specific performance level. The