

9. Echolocation in Dolphins
377
u
250
... ..
! 200
-'
'"
::l
150
'"
...
TWO-WRY TRRun TIME
...
!
..
100
~
-'
u
50
'"
... ...
!
10
20
30
40
50
CLICK ORDER
INTERPRCKET
INTERURl
PRCKETS
n
r,
I I_TWT
INITIRl
SERIES
r,
j]-t tt: :lH++--l+H--o
-
1.5
SECONDS
I - - -
3.0
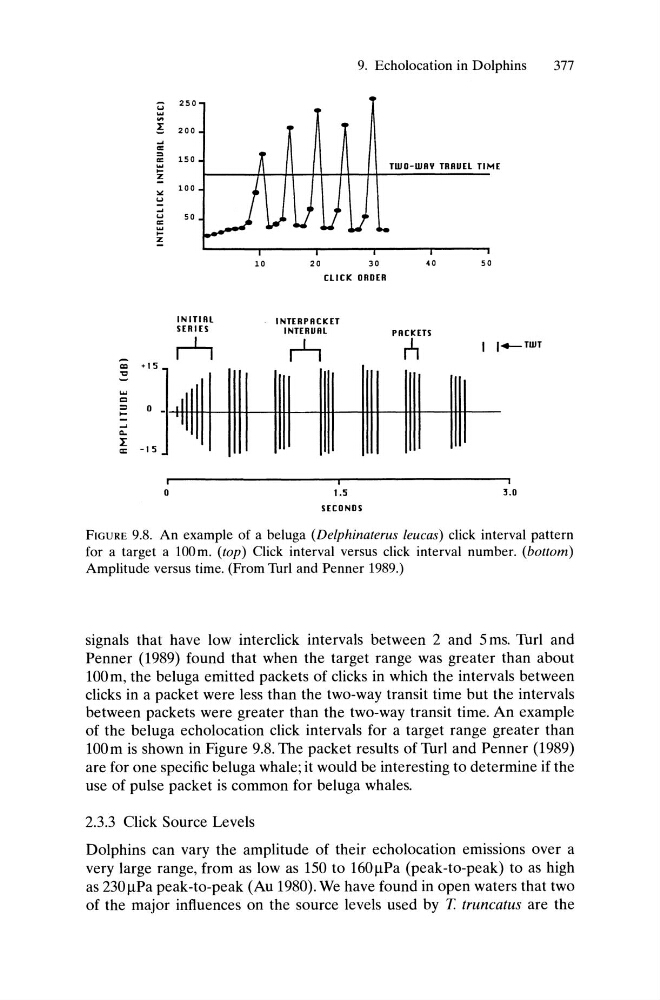
FIGURE 9.8. An example of a beluga (Delphinaterus leucas) click interval pattern
for a target a 100m. (top) Click interval versus click interval number. (bottom)
Amplitude versus time. (From Turl and Penner 1989.)
signals that have low interclick intervals between 2 and 5 ms. Turl and
Penner (1989) found that when the target range was greater than about
100m, the beluga emitted packets of clicks in which the intervals between
clicks in a packet were less than the two-way transit time but the intervals
between packets were greater than the two-way transit time. An example
of the beluga echolocation click intervals for a target range greater than
100m is shown in Figure 9.8. The packet results of Turl and Penner (1989)
are for one specific beluga whale; it would be interesting to determine if the
use of pulse packet is common for beluga whales.
2.3.3 Click Source Levels
Dolphins can vary the amplitude of their echolocation emissions over a
very large range, from as low as 150 to 160/lPa (peak-to-peak) to as high
as 230/lPa peak-to-peak (Au 1980). We have found in open waters that two
of the major influences on the source levels used by T. truncatus are the
377
u
250
... ..
! 200
-'
'"
::l
150
'"
...
TWO-WRY TRRun TIME
...
!
..
100
~
-'
u
50
'"
... ...
!
10
20
30
40
50
CLICK ORDER
INTERPRCKET
INTERURl
PRCKETS
n
r,
I I_TWT
INITIRl
SERIES
r,
j]-t tt: :lH++--l+H--o
-
1.5
SECONDS
I - - -
3.0
FIGURE 9.8. An example of a beluga (Delphinaterus leucas) click interval pattern
for a target a 100m. (top) Click interval versus click interval number. (bottom)
Amplitude versus time. (From Turl and Penner 1989.)
signals that have low interclick intervals between 2 and 5 ms. Turl and
Penner (1989) found that when the target range was greater than about
100m, the beluga emitted packets of clicks in which the intervals between
clicks in a packet were less than the two-way transit time but the intervals
between packets were greater than the two-way transit time. An example
of the beluga echolocation click intervals for a target range greater than
100m is shown in Figure 9.8. The packet results of Turl and Penner (1989)
are for one specific beluga whale; it would be interesting to determine if the
use of pulse packet is common for beluga whales.
2.3.3 Click Source Levels
Dolphins can vary the amplitude of their echolocation emissions over a
very large range, from as low as 150 to 160/lPa (peak-to-peak) to as high
as 230/lPa peak-to-peak (Au 1980). We have found in open waters that two
of the major influences on the source levels used by T. truncatus are the