

378
w.w.L. Au
230
i
AIm) TS (dB I
animal
210
a
6
-13.8
Sven
b
6
-17.7
Sven
c
6
-29.7
Ekahi
a
d
6
-33.0
Ekahi
e
6
-39.8
Ekahi
f
20
-28.2
Heptuna & Ehiku
9
50
-28.2
Sven
h
72.8 -28.2
Heptuna & Ehiku
77.7
-28.2
Sven & Niko
OJ
t.
m 220
B
en
I
200 L..-_---'-_ _...L.-_----I._ _--l-_ _' - - - _ - - ' -_ _..L..-_--'
40
60
80
100
120
TOTAL LOSS (dB) = 40 LOG R + 2 Q p R + TS
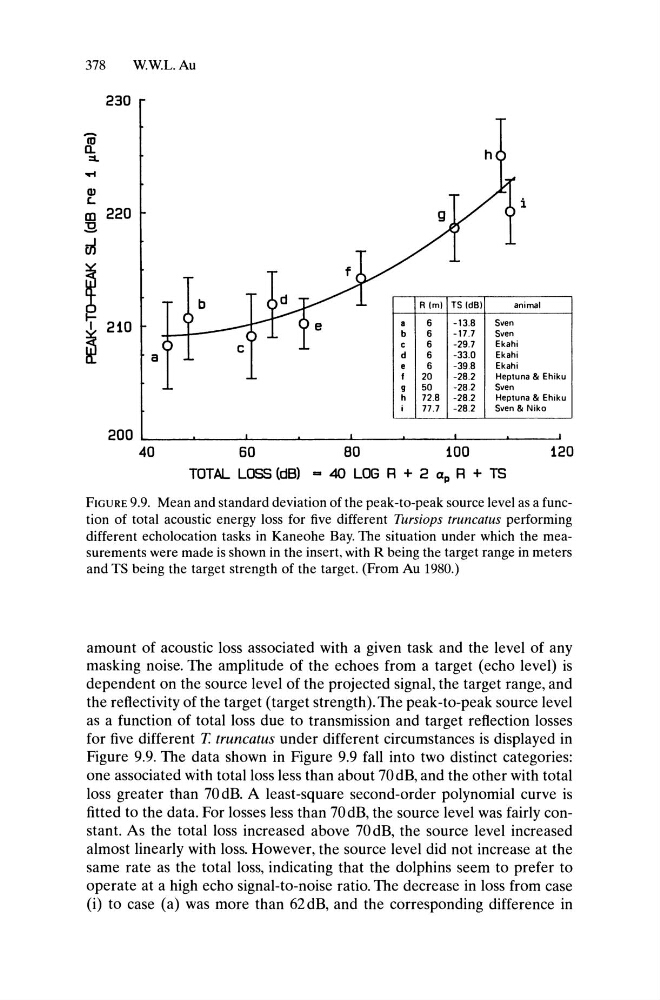
FIGURE 9.9. Mean and standard deviation of the peak-to-peak source level as a function of total acoustic energy loss for five different Tursiops truncatus performing
different echolocation tasks in Kaneohe Bay. The situation under which the measurements were made is shown in the insert, with R being the target range in meters
and TS being the target strength of the target. (From Au 1980.)
amount of acoustic loss associated with a given task and the level of any
masking noise. The amplitude of the echoes from a target (echo level) is
dependent on the source level of the projected signal, the target range, and
the reflectivity of the target (target strength). The peak-to-peak source level
as a function of total loss due to transmission and target reflection losses
for five different T. truncatus under different circumstances is displayed in
Figure 9.9. The data shown in Figure 9.9 fall into two distinct categories:
one associated with total loss less than about 70dB, and the other with total
loss greater than 70dB. A least-square second-order polynomial curve is
fitted to the data. For losses less than 70dB, the source level was fairly constant. As the total loss increased above 70dB, the source level increased
almost linearly with loss. However, the source level did not increase at the
same rate as the total loss, indicating that the dolphins seem to prefer to
operate at a high echo signal-to-noise ratio. The decrease in loss from case
(i) to case (a) was more than 62dB, and the corresponding difference in
w.w.L. Au
230
i
AIm) TS (dB I
animal
210
a
6
-13.8
Sven
b
6
-17.7
Sven
c
6
-29.7
Ekahi
a
d
6
-33.0
Ekahi
e
6
-39.8
Ekahi
f
20
-28.2
Heptuna & Ehiku
9
50
-28.2
Sven
h
72.8 -28.2
Heptuna & Ehiku
77.7
-28.2
Sven & Niko
OJ
t.
m 220
B
en
I
200 L..-_---'-_ _...L.-_----I._ _--l-_ _' - - - _ - - ' -_ _..L..-_--'
40
60
80
100
120
TOTAL LOSS (dB) = 40 LOG R + 2 Q p R + TS
FIGURE 9.9. Mean and standard deviation of the peak-to-peak source level as a function of total acoustic energy loss for five different Tursiops truncatus performing
different echolocation tasks in Kaneohe Bay. The situation under which the measurements were made is shown in the insert, with R being the target range in meters
and TS being the target strength of the target. (From Au 1980.)
amount of acoustic loss associated with a given task and the level of any
masking noise. The amplitude of the echoes from a target (echo level) is
dependent on the source level of the projected signal, the target range, and
the reflectivity of the target (target strength). The peak-to-peak source level
as a function of total loss due to transmission and target reflection losses
for five different T. truncatus under different circumstances is displayed in
Figure 9.9. The data shown in Figure 9.9 fall into two distinct categories:
one associated with total loss less than about 70dB, and the other with total
loss greater than 70dB. A least-square second-order polynomial curve is
fitted to the data. For losses less than 70dB, the source level was fairly constant. As the total loss increased above 70dB, the source level increased
almost linearly with loss. However, the source level did not increase at the
same rate as the total loss, indicating that the dolphins seem to prefer to
operate at a high echo signal-to-noise ratio. The decrease in loss from case
(i) to case (a) was more than 62dB, and the corresponding difference in