

356
PE. Nachtigall et at.
50
45
40
N
:I:
!35
III
'0
30
25
-6-CriticoI Rotios (Jollnson. 'lle8)
""*"Criticol Rotioo (Au & _ . 1 _ )
160
140
120
60
60
100
Frequency (kHz)
40
20
2O~--"""---+----+----+----+----+----+---"'"
o
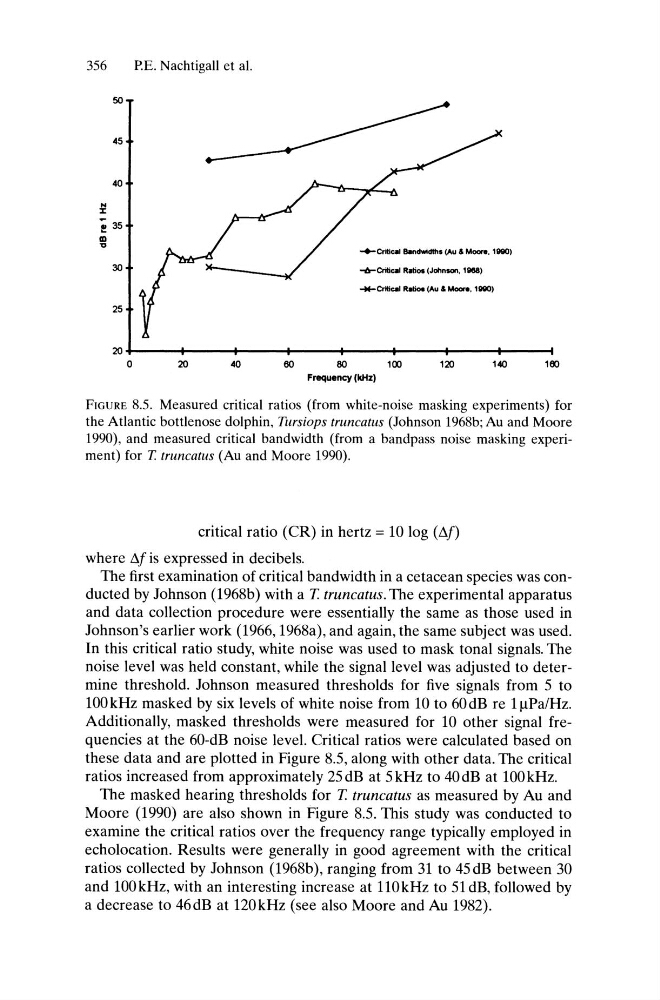
FIGURE 8.5. Measured critical ratios (from white-noise masking experiments) for
the Atlantic bottlenose dolphin, Tursiops truncatus (Johnson 1968b; Au and Moore
1990), and measured critical bandwidth (from a bandpass noise masking experiment) for T. truncatus (Au and Moore 1990).
critical ratio (CR) in hertz = 10 log (t:..f)
where N is expressed in decibels.
The first examination of critical bandwidth in a cetacean species was conducted by Johnson (1968b) with a T. truncatus. The experimental apparatus
and data collection procedure were essentially the same as those used in
Johnson's earlier work (1966, 1968a), and again, the same subject was used.
In this critical ratio study, white noise was used to mask tonal signals. The
noise level was held constant, while the signal level was adjusted to determine threshold. Johnson measured thresholds for five signals from 5 to
100 kHz masked by six levels of white noise from 10 to 60 dB re 1J,.lPa/Hz.
Additionally, masked thresholds were measured for 10 other signal frequencies at the 60-dB noise level. Critical ratios were calculated based on
these data and are plotted in Figure 8.5, along with other data. The critical
ratios increased from approximately 25dB at 5kHz to 40dB at 100kHz.
The masked hearing thresholds for T. truncatus as measured by Au and
Moore (1990) are also shown in Figure 8.5. This study was conducted to
examine the critical ratios over the frequency range typically employed in
echolocation. Results were generally in good agreement with the critical
ratios collected by Johnson (1968b), ranging from 31 to 45 dB between 30
and 100kHz, with an interesting increase at 110kHz to 51dB, followed by
a decrease to 46dB at 120kHz (see also Moore and Au 1982).
PE. Nachtigall et at.
50
45
40
N
:I:
!35
III
'0
30
25
-6-CriticoI Rotios (Jollnson. 'lle8)
""*"Criticol Rotioo (Au & _ . 1 _ )
160
140
120
60
60
100
Frequency (kHz)
40
20
2O~--"""---+----+----+----+----+----+---"'"
o
FIGURE 8.5. Measured critical ratios (from white-noise masking experiments) for
the Atlantic bottlenose dolphin, Tursiops truncatus (Johnson 1968b; Au and Moore
1990), and measured critical bandwidth (from a bandpass noise masking experiment) for T. truncatus (Au and Moore 1990).
critical ratio (CR) in hertz = 10 log (t:..f)
where N is expressed in decibels.
The first examination of critical bandwidth in a cetacean species was conducted by Johnson (1968b) with a T. truncatus. The experimental apparatus
and data collection procedure were essentially the same as those used in
Johnson's earlier work (1966, 1968a), and again, the same subject was used.
In this critical ratio study, white noise was used to mask tonal signals. The
noise level was held constant, while the signal level was adjusted to determine threshold. Johnson measured thresholds for five signals from 5 to
100 kHz masked by six levels of white noise from 10 to 60 dB re 1J,.lPa/Hz.
Additionally, masked thresholds were measured for 10 other signal frequencies at the 60-dB noise level. Critical ratios were calculated based on
these data and are plotted in Figure 8.5, along with other data. The critical
ratios increased from approximately 25dB at 5kHz to 40dB at 100kHz.
The masked hearing thresholds for T. truncatus as measured by Au and
Moore (1990) are also shown in Figure 8.5. This study was conducted to
examine the critical ratios over the frequency range typically employed in
echolocation. Results were generally in good agreement with the critical
ratios collected by Johnson (1968b), ranging from 31 to 45 dB between 30
and 100kHz, with an interesting increase at 110kHz to 51dB, followed by
a decrease to 46dB at 120kHz (see also Moore and Au 1982).