

298
W.E Dolphin
1.0
0.9
~
'2 08
:>
~ 0.7
m E 06
Ci
.s. 0.5
Q)
'"
~ 0.4
c:
C>
~ 0.3
02
•
5 . ,
102
Frequency (Hz)
•
5 . ,
1
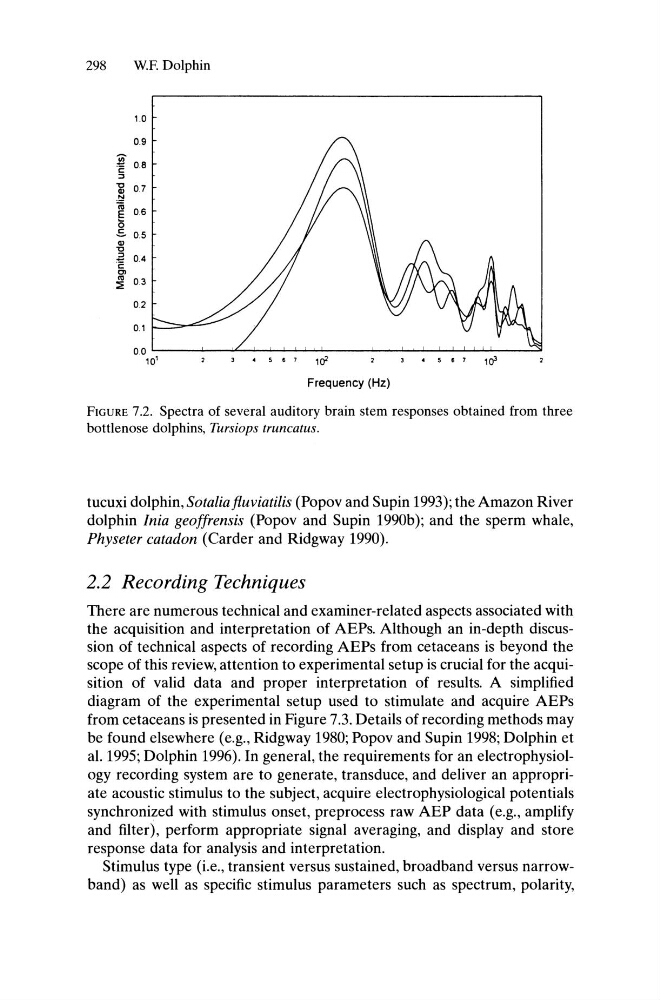
bottlenose dolphins, Tursiops truncatus.
tucuxi dolphin, Sotatia fluviatilis (Popov and Supin 1993); the Amazon River
dolphin lnia geoffrensis (Popov and Supin 1990b); and the sperm whale,
Physeter catadon (Carder and Ridgway 1990).
2.2 Recording Techniques
There are numerous technical and examiner-related aspects associated with
the acquisition and interpretation of AEPs. Although an in-depth discussion of technical aspects of recording AEPs from cetaceans is beyond the
scope of this review, attention to experimental setup is crucial for the acquisition of valid data and proper interpretation of results. A simplified
diagram of the experimental setup used to stimulate and acquire AEPs
from cetaceans is presented in Figure 7.3. Details of recording methods may
be found elsewhere (e.g., Ridgway 1980; Popov and Supin 1998; Dolphin et
al. 1995; Dolphin 1996). In general, the requirements for an electrophysiology recording system are to generate, transduce, and deliver an appropriate acoustic stimulus to the subject, acquire electrophysiological potentials
synchronized with stimulus onset, preprocess raw AEP data (e.g., amplify
and filter), perform appropriate signal averaging, and display and store
response data for analysis and interpretation.
Stimulus type (i.e., transient versus sustained, broadband versus narrowband) as well as specific stimulus parameters such as spectrum, polarity,
W.E Dolphin
1.0
0.9
~
'2 08
:>
~ 0.7
m E 06
Ci
.s. 0.5
Q)
'"
~ 0.4
c:
C>
~ 0.3
02
•
5 . ,
102
Frequency (Hz)
•
5 . ,
1
bottlenose dolphins, Tursiops truncatus.
tucuxi dolphin, Sotatia fluviatilis (Popov and Supin 1993); the Amazon River
dolphin lnia geoffrensis (Popov and Supin 1990b); and the sperm whale,
Physeter catadon (Carder and Ridgway 1990).
2.2 Recording Techniques
There are numerous technical and examiner-related aspects associated with
the acquisition and interpretation of AEPs. Although an in-depth discussion of technical aspects of recording AEPs from cetaceans is beyond the
scope of this review, attention to experimental setup is crucial for the acquisition of valid data and proper interpretation of results. A simplified
diagram of the experimental setup used to stimulate and acquire AEPs
from cetaceans is presented in Figure 7.3. Details of recording methods may
be found elsewhere (e.g., Ridgway 1980; Popov and Supin 1998; Dolphin et
al. 1995; Dolphin 1996). In general, the requirements for an electrophysiology recording system are to generate, transduce, and deliver an appropriate acoustic stimulus to the subject, acquire electrophysiological potentials
synchronized with stimulus onset, preprocess raw AEP data (e.g., amplify
and filter), perform appropriate signal averaging, and display and store
response data for analysis and interpretation.
Stimulus type (i.e., transient versus sustained, broadband versus narrowband) as well as specific stimulus parameters such as spectrum, polarity,