

181
two rookeries, and no significant difference between Rocas Atoll and Fernando de
Noronha (Bjorndal et al. 2006).
Later, the stock structure of the Brazilian rookeries was reexamined using the
mitochondrial short tandem repeat (mtSTR) marker and expanded control-region
sequences. Results revealed significant structure between Rocas Atoll and Fernando
de Noronha separated by only 150 km, indicating that these rookeries are discrete
populations with respect to female natal homing (Shamblin et al. 2015).
Although feeding grounds (FGs) in Brazil were differentiated among them,
intra-regional structure was less pronounced. Ascension was the primary natal
source of the study FGs, with Surinam and Trindade as secondary sources (NaroMaciel et al. 2012).
7.3.3 Hawksbill, Eretmochelys imbricata
Hawksbill turtles from the two main rookeries in Brazil (Bahia and Pipa) are inserted
within the Southwest Atlantic Regional Management Unit (RMU) (Wallace et al.
2010). The two rookeries are related, even though they belong to different genetic
stocks. By using sequences of the mtDNA control region and autosomal genes
Vilaça et al. (2013) revealed striking differences between the two Brazilian nesting
sites studied.
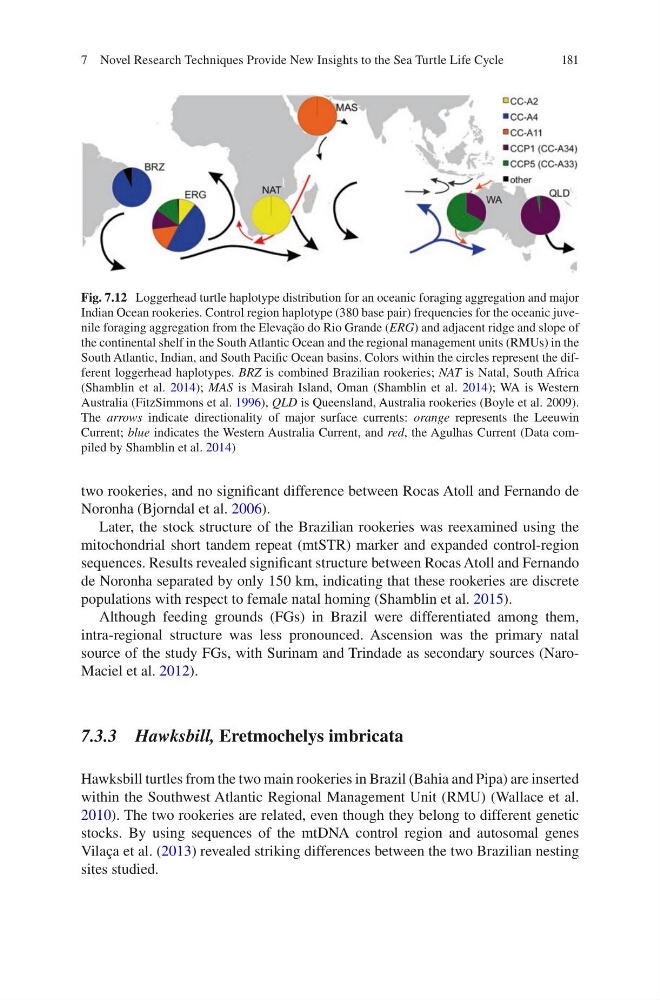
Fig. 7.12 Loggerhead turtle haplotype distribution for an oceanic foraging aggregation and major
Indian Ocean rookeries. Control region haplotype (380 base pair) frequencies for the oceanic juvenile foraging aggregation from the Elevação do Rio Grande (ERG) and adjacent ridge and slope of
the continental shelf in the South Atlantic Ocean and the regional management units (RMUs) in the
South Atlantic, Indian, and South Pacific Ocean basins. Colors within the circles represent the different loggerhead haplotypes. BRZ is combined Brazilian rookeries; NAT is Natal, South Africa
(Shamblin et al. 2014); MAS is Masirah Island, Oman (Shamblin et al. 2014); WA is Western
Australia (FitzSimmons et al. 1996), QLD is Queensland, Australia rookeries (Boyle et al. 2009).
The arrows indicate directionality of major surface currents: orange represents the Leeuwin
Current; blue indicates the Western Australia Current, and red, the Agulhas Current (Data compiled by Shamblin et al. 2014)
7 Novel Research Techniques Provide New Insights to the Sea Turtle Life Cycle
two rookeries, and no significant difference between Rocas Atoll and Fernando de
Noronha (Bjorndal et al. 2006).
Later, the stock structure of the Brazilian rookeries was reexamined using the
mitochondrial short tandem repeat (mtSTR) marker and expanded control-region
sequences. Results revealed significant structure between Rocas Atoll and Fernando
de Noronha separated by only 150 km, indicating that these rookeries are discrete
populations with respect to female natal homing (Shamblin et al. 2015).
Although feeding grounds (FGs) in Brazil were differentiated among them,
intra-regional structure was less pronounced. Ascension was the primary natal
source of the study FGs, with Surinam and Trindade as secondary sources (NaroMaciel et al. 2012).
7.3.3 Hawksbill, Eretmochelys imbricata
Hawksbill turtles from the two main rookeries in Brazil (Bahia and Pipa) are inserted
within the Southwest Atlantic Regional Management Unit (RMU) (Wallace et al.
2010). The two rookeries are related, even though they belong to different genetic
stocks. By using sequences of the mtDNA control region and autosomal genes
Vilaça et al. (2013) revealed striking differences between the two Brazilian nesting
sites studied.
Fig. 7.12 Loggerhead turtle haplotype distribution for an oceanic foraging aggregation and major
Indian Ocean rookeries. Control region haplotype (380 base pair) frequencies for the oceanic juvenile foraging aggregation from the Elevação do Rio Grande (ERG) and adjacent ridge and slope of
the continental shelf in the South Atlantic Ocean and the regional management units (RMUs) in the
South Atlantic, Indian, and South Pacific Ocean basins. Colors within the circles represent the different loggerhead haplotypes. BRZ is combined Brazilian rookeries; NAT is Natal, South Africa
(Shamblin et al. 2014); MAS is Masirah Island, Oman (Shamblin et al. 2014); WA is Western
Australia (FitzSimmons et al. 1996), QLD is Queensland, Australia rookeries (Boyle et al. 2009).
The arrows indicate directionality of major surface currents: orange represents the Leeuwin
Current; blue indicates the Western Australia Current, and red, the Agulhas Current (Data compiled by Shamblin et al. 2014)
7 Novel Research Techniques Provide New Insights to the Sea Turtle Life Cycle