

180
larger sample sizes from the Brazilian rookeries is necessary to better resolve the
number of MUs and their boundaries.
Mixed Stock Analysis (MSA) indicated a major contribution to the ERG foraging aggregation from Brazil (mean 59.5%). However, the ERG aggregation is a
mixed stock with haplotypes from worldwide rookeries such as northwestern
Atlantic, Mediterranean, Western Australia, Queensland, and New Caledonia
(Fig. 7.12). However, the MSA results must be interpreted with care, since this
analysis assumes that all source rookeries are known, but African and Indo-Pacific
rookeries have been very poorly surveyed (Shamblin et al. 2014).
7.3.2 Green Turtle, Chelonia mydas
The genetic structure of nesting populations of green turtles nesting at the three
known rookeries in Brazil were assessed: Trindade (n = 99), Rocas Atoll (n = 37),
and Fernando de Noronha (n = 16) (Fig. 7.13). This study, based on short mtDNA
control-region haplotypes suggested genetic structuring of green turtle populations,
with haplotype frequencies significantly different between Trindade and the other
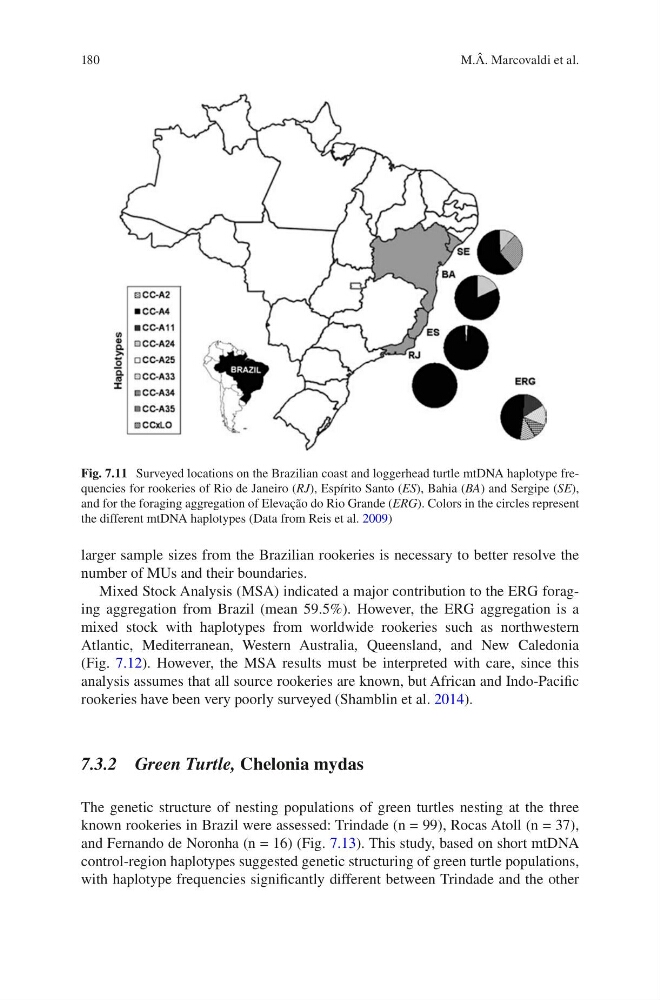
Fig. 7.11 Surveyed locations on the Brazilian coast and loggerhead turtle mtDNA haplotype frequencies for rookeries of Rio de Janeiro (RJ), Espírito Santo (ES), Bahia (BA) and Sergipe (SE),
and for the foraging aggregation of Elevação do Rio Grande (ERG). Colors in the circles represent
the different mtDNA haplotypes (Data from Reis et al. 2009)
M.Â. Marcovaldi et al.
larger sample sizes from the Brazilian rookeries is necessary to better resolve the
number of MUs and their boundaries.
Mixed Stock Analysis (MSA) indicated a major contribution to the ERG foraging aggregation from Brazil (mean 59.5%). However, the ERG aggregation is a
mixed stock with haplotypes from worldwide rookeries such as northwestern
Atlantic, Mediterranean, Western Australia, Queensland, and New Caledonia
(Fig. 7.12). However, the MSA results must be interpreted with care, since this
analysis assumes that all source rookeries are known, but African and Indo-Pacific
rookeries have been very poorly surveyed (Shamblin et al. 2014).
7.3.2 Green Turtle, Chelonia mydas
The genetic structure of nesting populations of green turtles nesting at the three
known rookeries in Brazil were assessed: Trindade (n = 99), Rocas Atoll (n = 37),
and Fernando de Noronha (n = 16) (Fig. 7.13). This study, based on short mtDNA
control-region haplotypes suggested genetic structuring of green turtle populations,
with haplotype frequencies significantly different between Trindade and the other
Fig. 7.11 Surveyed locations on the Brazilian coast and loggerhead turtle mtDNA haplotype frequencies for rookeries of Rio de Janeiro (RJ), Espírito Santo (ES), Bahia (BA) and Sergipe (SE),
and for the foraging aggregation of Elevação do Rio Grande (ERG). Colors in the circles represent
the different mtDNA haplotypes (Data from Reis et al. 2009)
M.Â. Marcovaldi et al.