

29 Spectral Imaging Analysis of Metaphase and Interphase Cells
381
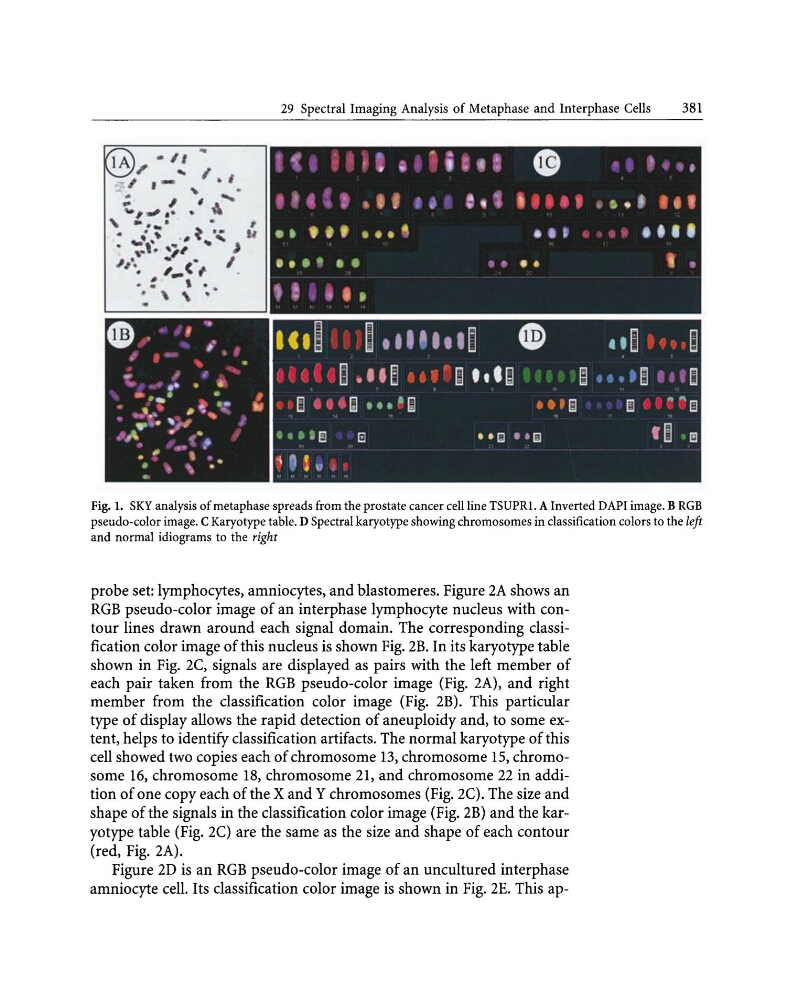
Fig. 1. SKY analysis of metaphase spreads from the prostate cancer cell line TSUPRl. A Inverted DAPI image. B RGB
pseudo-color image. C Karyotype table. D Spectral karyotype showing chromosomes in classification colors to the left
and normal idiograms to the right
probe set: lymphocytes, amniocytes, and blastomeres. Figure 2A shows an
RGB pseudo-color image of an interphase lymphocyte nucleus with contour lines drawn around each signal domain. The corresponding classification color image of this nucleus is shown Fig. 2B. In its karyotype table
shown in Fig. 2C, signals are displayed as pairs with the left member of
each pair taken from the RGB pseudo-color image (Fig. 2A), and right
member from the classification color image (Fig. 2B). This particular
type of display allows the rapid detection of aneuploidy and, to some extent, helps to identify classification artifacts. The normal karyotype of this
cell showed two copies each of chromosome 13, chromosome 15, chromosome 16, chromosome 18, chromosome 21, and chromosome 22 in addition of one copy each of the X and Y chromosomes (Fig. 2e). The size and
shape of the signals in the classification color image (Fig. 2B) and the karyotype table (Fig. 2C) are the same as the size and shape of each contour
(red, Fig. 2A).
Figure 2D is an RGB pseudo-color image of an uncultured interphase
amniocyte cell. Its classification color image is shown in Fig. 2E. This ap-
381
Fig. 1. SKY analysis of metaphase spreads from the prostate cancer cell line TSUPRl. A Inverted DAPI image. B RGB
pseudo-color image. C Karyotype table. D Spectral karyotype showing chromosomes in classification colors to the left
and normal idiograms to the right
probe set: lymphocytes, amniocytes, and blastomeres. Figure 2A shows an
RGB pseudo-color image of an interphase lymphocyte nucleus with contour lines drawn around each signal domain. The corresponding classification color image of this nucleus is shown Fig. 2B. In its karyotype table
shown in Fig. 2C, signals are displayed as pairs with the left member of
each pair taken from the RGB pseudo-color image (Fig. 2A), and right
member from the classification color image (Fig. 2B). This particular
type of display allows the rapid detection of aneuploidy and, to some extent, helps to identify classification artifacts. The normal karyotype of this
cell showed two copies each of chromosome 13, chromosome 15, chromosome 16, chromosome 18, chromosome 21, and chromosome 22 in addition of one copy each of the X and Y chromosomes (Fig. 2e). The size and
shape of the signals in the classification color image (Fig. 2B) and the karyotype table (Fig. 2C) are the same as the size and shape of each contour
(red, Fig. 2A).
Figure 2D is an RGB pseudo-color image of an uncultured interphase
amniocyte cell. Its classification color image is shown in Fig. 2E. This ap-