

382
JINGLY FUNG et aI.
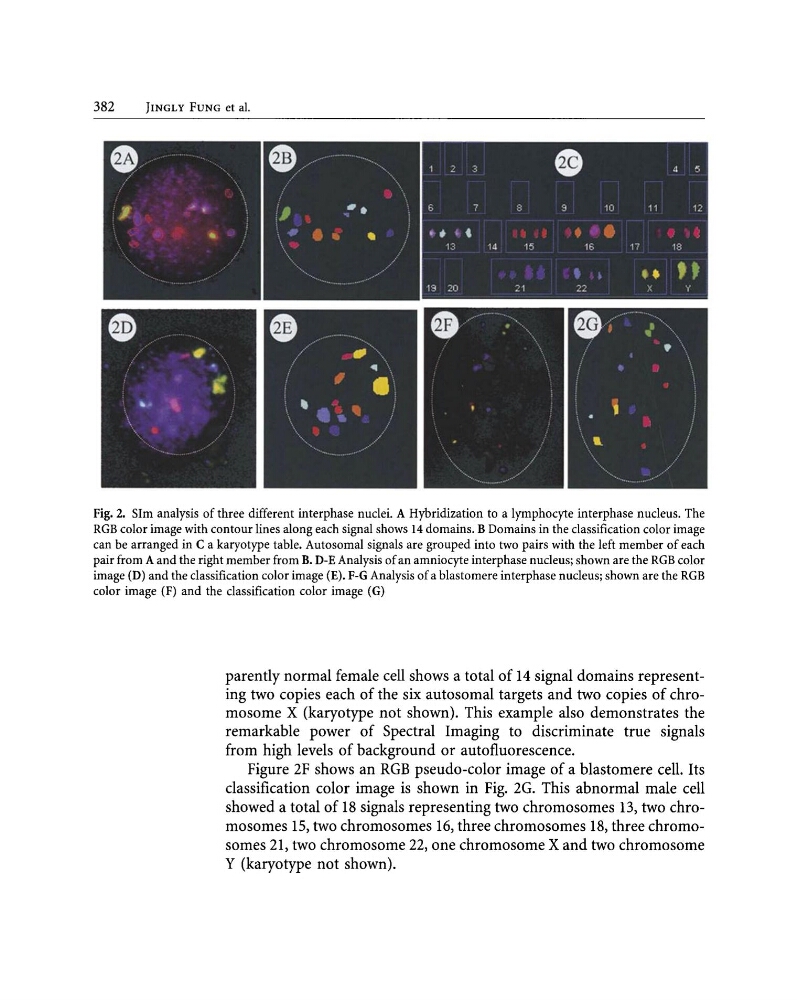
Fig. 2. SIm analysis of three different interphase nuclei. A Hybridization to a lymphocyte interphase nucleus. The
RGB color image with contour lines along each signal shows 14 domains. B Domains in the classification color image
can be arranged in C a karyotype table. Autosomal signals are grouped into two pairs with the left member of each
pair from A and the right member from B. D-E Analysis of an amniocyte interphase nucleus; shown are the RGB color
image (D) and the classification color image (E). F-G Analysis of a blastomere interphase nucleus; shown are the RGB
color image (F) and the classification color image (G)
parently normal female cell shows a total of 14 signal domains representing two copies each of the six autosomal targets and two copies of chromosome X (karyotype not shown). This example also demonstrates the
remarkable power of Spectral Imaging to discriminate true signals
from high levels of background or autofluorescence.
Figure 2F shows an RGB pseudo-color image of a blastomere cell. Its
classification color image is shown in Fig. 2G. This abnormal male cell
showed a total of 18 signals representing two chromosomes 13, two chromosomes 15, two chromosomes 16, three chromosomes 18, three chromosomes 21, two chromosome 22, one chromosome X and two chromosome
Y (karyotype not shown).
JINGLY FUNG et aI.
Fig. 2. SIm analysis of three different interphase nuclei. A Hybridization to a lymphocyte interphase nucleus. The
RGB color image with contour lines along each signal shows 14 domains. B Domains in the classification color image
can be arranged in C a karyotype table. Autosomal signals are grouped into two pairs with the left member of each
pair from A and the right member from B. D-E Analysis of an amniocyte interphase nucleus; shown are the RGB color
image (D) and the classification color image (E). F-G Analysis of a blastomere interphase nucleus; shown are the RGB
color image (F) and the classification color image (G)
parently normal female cell shows a total of 14 signal domains representing two copies each of the six autosomal targets and two copies of chromosome X (karyotype not shown). This example also demonstrates the
remarkable power of Spectral Imaging to discriminate true signals
from high levels of background or autofluorescence.
Figure 2F shows an RGB pseudo-color image of a blastomere cell. Its
classification color image is shown in Fig. 2G. This abnormal male cell
showed a total of 18 signals representing two chromosomes 13, two chromosomes 15, two chromosomes 16, three chromosomes 18, three chromosomes 21, two chromosome 22, one chromosome X and two chromosome
Y (karyotype not shown).