

-0
o
'L:
Q)
0.
Q)
>
.....
U
:J
-0
o
I0.
Q)
IQ)
I0.
60
40
20
o
10
o BMT
• LMT
v LTR
15
20
25
30
t
( oC)
tempera ure
,..-...
(f)
>0
-0
-0
0
'L:
Q)
0.
Q)
>
.....
u
:J
-0
0
I0.
Q)
I,..-...
(f)
>0
-0
........,
c
0
0.
(f)
Q)
....
35
299
110
88
66
44
22
0
10
15
20
25
30
35
160
120
80
40
0
10
15
20
25
30
35
temperature (C)
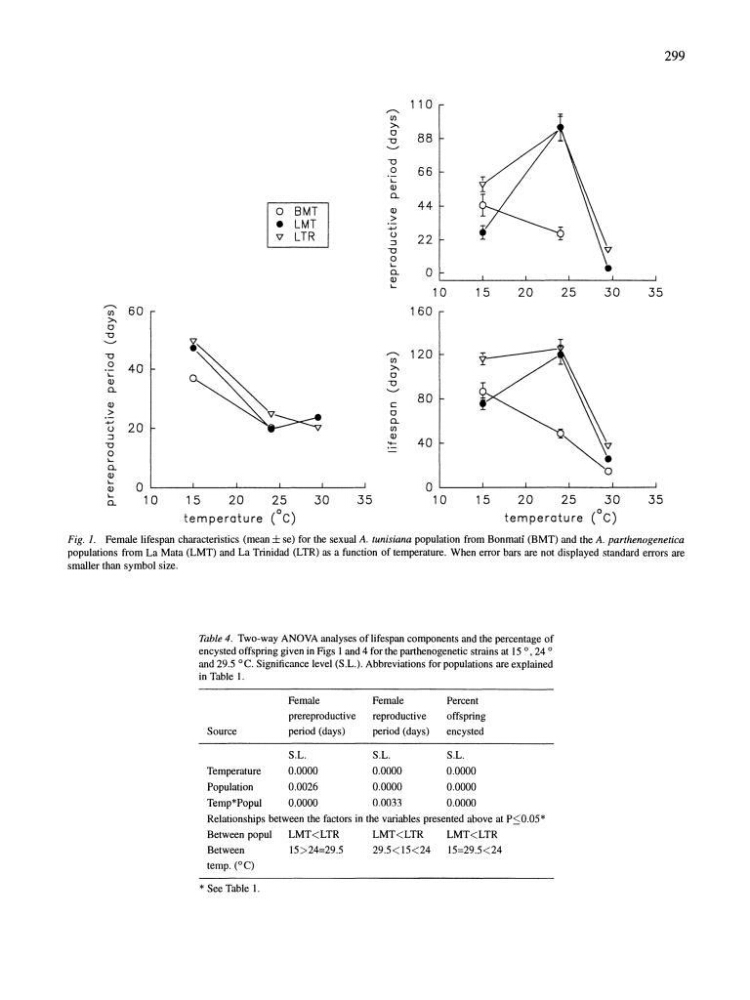
Fig. 1. Female lifespan characteristics (mean ± se) for the sexual A. tunisiana population from Bonmati (BMT) and the A. parthenogenetica
populations from La Mata (LMT) and La Trinidad (LTR) as a function of temperature. When error bars are not displayed standard errors are
smaller than symbol size.
Table 4. Two-way ANOVA analyses of lifespan components and the percentage of
encysted offspring given in Figs I and 4 for the parthenogenetic strains at 15 0, 24 °
and 29.5 0c. Significance level (S.L.). Abbreviations for populations are explained
in Table I.
Female
Female
Percent
prereproductive
reproductive
offspring
Source
period (days)
period (days)
encysted
S.L.
S.L.
S.L.
Temperature
0.0000
0.0000
0.0000
Population
0.0026
0.0000
0.0000
Temp*Popul
0.0000
0.0033
0.0000
Relationships between the factors in the variables presented above at P:::;0.05*
Between popul
LMT
15>24=29.5
29.5< 15<24
15=29.5<24
temp. (0C)
* See Table 1.
o
'L:
Q)
0.
Q)
>
.....
U
:J
-0
o
I0.
Q)
IQ)
I0.
60
40
20
o
10
o BMT
• LMT
v LTR
15
20
25
30
t
( oC)
tempera ure
,..-...
(f)
>0
-0
-0
0
'L:
Q)
0.
Q)
>
.....
u
:J
-0
0
I0.
Q)
I,..-...
(f)
>0
-0
........,
c
0
0.
(f)
Q)
....
35
299
110
88
66
44
22
0
10
15
20
25
30
35
160
120
80
40
0
10
15
20
25
30
35
temperature (C)
Fig. 1. Female lifespan characteristics (mean ± se) for the sexual A. tunisiana population from Bonmati (BMT) and the A. parthenogenetica
populations from La Mata (LMT) and La Trinidad (LTR) as a function of temperature. When error bars are not displayed standard errors are
smaller than symbol size.
Table 4. Two-way ANOVA analyses of lifespan components and the percentage of
encysted offspring given in Figs I and 4 for the parthenogenetic strains at 15 0, 24 °
and 29.5 0c. Significance level (S.L.). Abbreviations for populations are explained
in Table I.
Female
Female
Percent
prereproductive
reproductive
offspring
Source
period (days)
period (days)
encysted
S.L.
S.L.
S.L.
Temperature
0.0000
0.0000
0.0000
Population
0.0026
0.0000
0.0000
Temp*Popul
0.0000
0.0033
0.0000
Relationships between the factors in the variables presented above at P:::;0.05*
Between popul
LMT
15>24=29.5
29.5< 15<24
15=29.5<24
temp. (0C)
* See Table 1.