

298
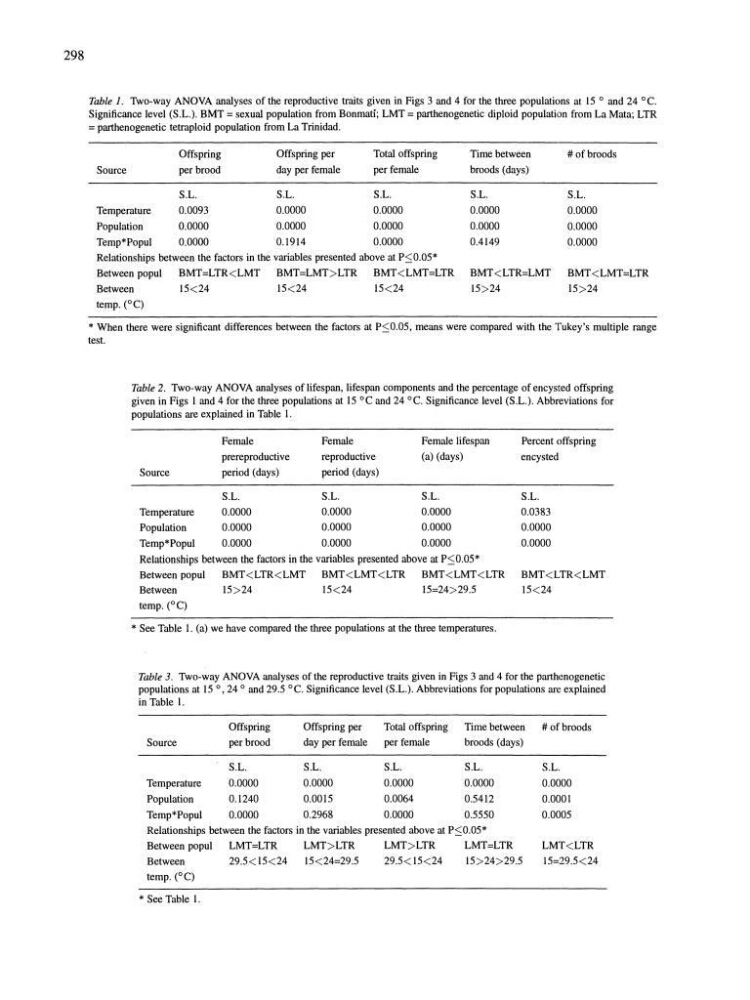
Table 1. Two-way ANOVA analyses of the reproductive traits given in Figs 3 and 4 for the three populations at 15 ° and 24°C.
Significance level (S.L.). BMT = sexual population from Bonmati; LMT = parthenogenetic diploid population from La Mata; LTR
= parthenogenetic tetraploid population from La Trinidad.
Offspring
Offspring per
Total offspring
Time between
# of broods
Source
per brood
day per female
per female
broods (days)
S.L.
S.L.
S.L.
S.L.
S.L.
Temperature
0.0093
0.0000
0.0000
0.0000
0.0000
Population
0.0000
0.0000
0.0000
0.0000
0.0000
Temp*Popul
0.0000
0.1914
0.0000
0.4149
0.0000
Relationships between the factors in the variables presented above at PSO.05*
Between popul
BMT=LTR
BMT
15<24
15<24
15<24
15>24
15>24
temp. (0C)
* When there were significant differences between the factors at PSO.05, means were compared with the Tukey's mUltiple range
test.
Table 2. Two-way ANOVA analyses of lifespan, lifespan components and the percentage of encysted offspring
given in Figs I and 4 for the three populations at 15°C and 24 0c. Significance level (S.L.). Abbreviations for
populations are explained in Table 1.
Female
Female
Female lifespan
prereproductive
reproductive
(a) (days)
Source
period (days)
period (days)
S.L.
S.L.
S.L.
Temperature
0.0000
0.0000
0.0000
Population
0.0000
0.0000
0.0000
Temp*Popul
0.0000
0.0000
0.0000
Relationships between the factors in the variables presented above at PSO.05*
Between popul
BMT
15>24
15<24
15=24>29.5
temp. (0C)
* See Table 1. (a) we have compared the three populations at the three temperatures.
Percent offspring
encysted
S.L.
0.0383
0.0000
0.0000
BMT
Table 3. Two-way ANOVA analyses of the reproductive traits given in Figs 3 and 4 for the parthenogenetic
populations at 15 °,24 ° and 29.5 °C. Significance level (S.L.). Abbreviations for popUlations are. explained
in Table 1.
Offspring
Offspring per
Total offspring
Time between
Source
per brood
day per female
per female
broods (days)
S.L.
S.L.
S.L.
S.L.
Temperature
0.0000
0.0000
0.0000
0.0000
Population
0.1240
0.0015
0.0064
0.5412
Temp*Popul
0.0000
0.2968
0.0000
0.5550
Relationships between the factors in the variables presented above at PSO.05*
Between popul
Between
temp. (0C)
* See Table 1.
LMT=LTR
LMT>LTR
29.5< 15<24
15<24=29.5
LMT>LTR
LMT=LTR
29.5<15<24
15>24>29.5
# of broods
S.L.
0.0000
0.0001
0.0005
LMT
Table 1. Two-way ANOVA analyses of the reproductive traits given in Figs 3 and 4 for the three populations at 15 ° and 24°C.
Significance level (S.L.). BMT = sexual population from Bonmati; LMT = parthenogenetic diploid population from La Mata; LTR
= parthenogenetic tetraploid population from La Trinidad.
Offspring
Offspring per
Total offspring
Time between
# of broods
Source
per brood
day per female
per female
broods (days)
S.L.
S.L.
S.L.
S.L.
S.L.
Temperature
0.0093
0.0000
0.0000
0.0000
0.0000
Population
0.0000
0.0000
0.0000
0.0000
0.0000
Temp*Popul
0.0000
0.1914
0.0000
0.4149
0.0000
Relationships between the factors in the variables presented above at PSO.05*
Between popul
BMT=LTR
BMT
15<24
15<24
15<24
15>24
15>24
temp. (0C)
* When there were significant differences between the factors at PSO.05, means were compared with the Tukey's mUltiple range
test.
Table 2. Two-way ANOVA analyses of lifespan, lifespan components and the percentage of encysted offspring
given in Figs I and 4 for the three populations at 15°C and 24 0c. Significance level (S.L.). Abbreviations for
populations are explained in Table 1.
Female
Female
Female lifespan
prereproductive
reproductive
(a) (days)
Source
period (days)
period (days)
S.L.
S.L.
S.L.
Temperature
0.0000
0.0000
0.0000
Population
0.0000
0.0000
0.0000
Temp*Popul
0.0000
0.0000
0.0000
Relationships between the factors in the variables presented above at PSO.05*
Between popul
BMT
15>24
15<24
15=24>29.5
temp. (0C)
* See Table 1. (a) we have compared the three populations at the three temperatures.
Percent offspring
encysted
S.L.
0.0383
0.0000
0.0000
BMT
Table 3. Two-way ANOVA analyses of the reproductive traits given in Figs 3 and 4 for the parthenogenetic
populations at 15 °,24 ° and 29.5 °C. Significance level (S.L.). Abbreviations for popUlations are. explained
in Table 1.
Offspring
Offspring per
Total offspring
Time between
Source
per brood
day per female
per female
broods (days)
S.L.
S.L.
S.L.
S.L.
Temperature
0.0000
0.0000
0.0000
0.0000
Population
0.1240
0.0015
0.0064
0.5412
Temp*Popul
0.0000
0.2968
0.0000
0.5550
Relationships between the factors in the variables presented above at PSO.05*
Between popul
Between
temp. (0C)
* See Table 1.
LMT=LTR
LMT>LTR
29.5< 15<24
15<24=29.5
LMT>LTR
LMT=LTR
29.5<15<24
15>24>29.5
# of broods
S.L.
0.0000
0.0001
0.0005
LMT