

150
water level in the culture vessels was controlled by
an outflow tube. The water flowing out from the vessels was discharged. A light regime of 16L18D was
maintained.
Basic feeding schedule
No literature data on specific yeast concentrations in
a flow-through culture system are available. After a
number of trials, we found that on culture day 10, a
final concentration of ca 700-900 10 3 yeast cells ml- I ,
was sufficient to obtain mature adults (ca 20.0 mm total
length) at a density of ca 1 shrimp per 10 ml. These data
served as our basis for determining a feeding schedule
(Table 1). It was applied to all flow-through test cultures. After day 10, depending on the condition and
size of the animals, the food supply was adjusted to
avoid an excess by daily inspection on the yeast cell
concentration, which was estimated using an improved
Neubauer counting chamber. During the first culture
periods (1 to 9 days), the food suspension was prepared
every 24 h. From culture day 10, the food suspension
was prepared every 12 h. To maintain the appropriate
yeast concentration in the culture vessels, it was necessary to clean the food filter and distributor tubes, every
two days.
A better utilization of the yeast food by the shrimps
is obtained when inert particles are added. However,
because the organic content of the clay was unknown,
and because dissolved organic matter can be a source
of particulate food for filter-feeders like Artemia (Baylor & Sutcliffe, 1963), we used a commercial amorphic
silicium dioxide (powder containing 87% pure siliciurn acid, Flugge, Germany) as a standard source of
inert particles. The size distribution of its particulate
composition, revealed about 45% of 2 J.Lm particles
(Fig. 7). The concentrations of silicium in the feeding schedule, were determined from observations on
the percentage of 'empty' yeast cells in faecal pellets
of shrimps, during preliminary tests. We noted that at
a concentration of 0.15-0.20 g I-I of silicium during
culture days 6-8 (flow rate 1.25 ml min -I), the percentage of 'empty' cells was ca 50% or more. This
concentration of silicium is similar to the concentrations of clay which gave high percentages of 'empty'
cells in faecal pellets (Figs 1 & 2).
100
A
.. 80
. .
E
' "
60
..
.. 0
. .
"
40
"" E
:s
c
20
0
100
B
. .
... 80
10
~
>
5 60
"
"
>
~ 40
10
...
:J
E
~ 20
0
0
2
4
6
8
10
12
14
deys of culture
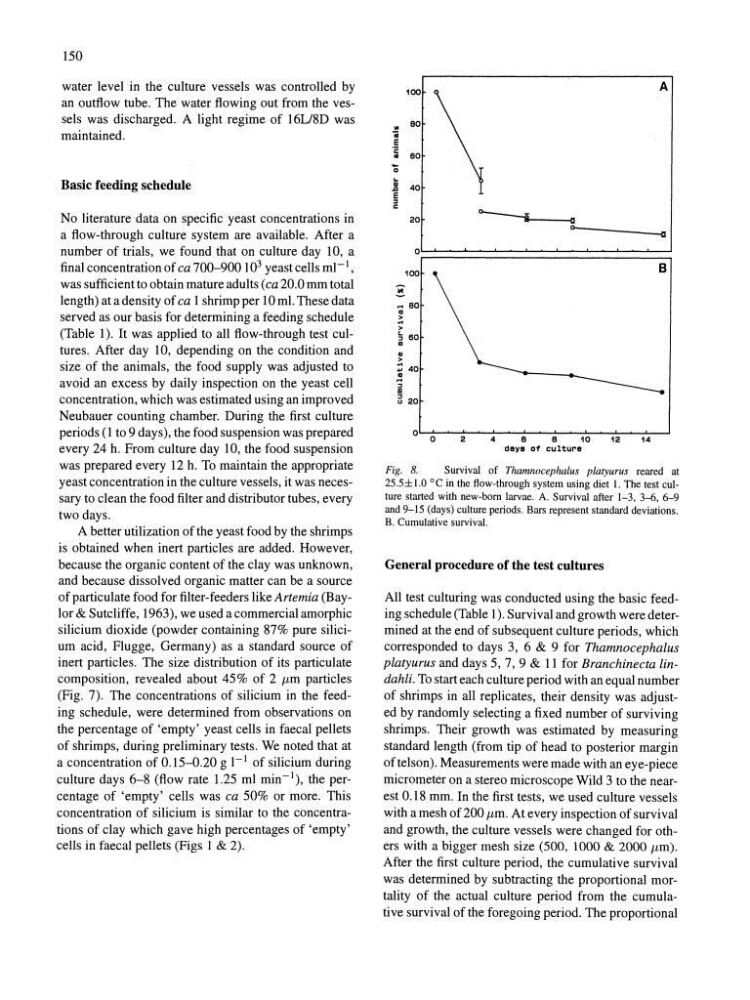
Fig. 8.
Survival of Thamnocephalus platyurus reared at
25.5±1.0 °C in the flow-through system using diet 1. The test culture started with new-born larvae. A. Survival after 1-3, 3-D, 6-9
and 9-15 (days) culture periods. Bars represent standard deviations.
B. Cumulative survival.
General procedure of the test cultures
All test culturing was conducted using the basic feeding schedule (Table 1). Survival and growth were determined at the end of subsequent culture periods, which
corresponded to days 3, 6 & 9 for Thamnocephalus
platyurus and days 5, 7, 9 & 11 for Branchinecta lindahli. To start each culture period with an equal number
of shrimps in all replicates, their density was adjusted by randomly selecting a fixed number of surviving
shrimps. Their growth was estimated by measuring
standard length (from tip of head to posterior margin
of telson). Measurements were made with an eye-piece
micrometer on a stereo microscope Wild 3 to the nearest 0.18 mm. In the first tests, we used culture vessels
with a mesh of 200 J.Lm. At every inspection of survival
and growth, the culture vessels were changed for others with a bigger mesh size (500, 1000 & 2000 J.Lm).
After the first culture period, the cumulative survival
was determined by subtracting the proportional mortality of the actual culture period from the cumulative survival of the foregoing period. The proportional
water level in the culture vessels was controlled by
an outflow tube. The water flowing out from the vessels was discharged. A light regime of 16L18D was
maintained.
Basic feeding schedule
No literature data on specific yeast concentrations in
a flow-through culture system are available. After a
number of trials, we found that on culture day 10, a
final concentration of ca 700-900 10 3 yeast cells ml- I ,
was sufficient to obtain mature adults (ca 20.0 mm total
length) at a density of ca 1 shrimp per 10 ml. These data
served as our basis for determining a feeding schedule
(Table 1). It was applied to all flow-through test cultures. After day 10, depending on the condition and
size of the animals, the food supply was adjusted to
avoid an excess by daily inspection on the yeast cell
concentration, which was estimated using an improved
Neubauer counting chamber. During the first culture
periods (1 to 9 days), the food suspension was prepared
every 24 h. From culture day 10, the food suspension
was prepared every 12 h. To maintain the appropriate
yeast concentration in the culture vessels, it was necessary to clean the food filter and distributor tubes, every
two days.
A better utilization of the yeast food by the shrimps
is obtained when inert particles are added. However,
because the organic content of the clay was unknown,
and because dissolved organic matter can be a source
of particulate food for filter-feeders like Artemia (Baylor & Sutcliffe, 1963), we used a commercial amorphic
silicium dioxide (powder containing 87% pure siliciurn acid, Flugge, Germany) as a standard source of
inert particles. The size distribution of its particulate
composition, revealed about 45% of 2 J.Lm particles
(Fig. 7). The concentrations of silicium in the feeding schedule, were determined from observations on
the percentage of 'empty' yeast cells in faecal pellets
of shrimps, during preliminary tests. We noted that at
a concentration of 0.15-0.20 g I-I of silicium during
culture days 6-8 (flow rate 1.25 ml min -I), the percentage of 'empty' cells was ca 50% or more. This
concentration of silicium is similar to the concentrations of clay which gave high percentages of 'empty'
cells in faecal pellets (Figs 1 & 2).
100
A
.. 80
. .
E
' "
60
..
.. 0
. .
"
40
"" E
:s
c
20
0
100
B
. .
... 80
10
~
>
5 60
"
"
>
~ 40
10
...
:J
E
~ 20
0
0
2
4
6
8
10
12
14
deys of culture
Fig. 8.
Survival of Thamnocephalus platyurus reared at
25.5±1.0 °C in the flow-through system using diet 1. The test culture started with new-born larvae. A. Survival after 1-3, 3-D, 6-9
and 9-15 (days) culture periods. Bars represent standard deviations.
B. Cumulative survival.
General procedure of the test cultures
All test culturing was conducted using the basic feeding schedule (Table 1). Survival and growth were determined at the end of subsequent culture periods, which
corresponded to days 3, 6 & 9 for Thamnocephalus
platyurus and days 5, 7, 9 & 11 for Branchinecta lindahli. To start each culture period with an equal number
of shrimps in all replicates, their density was adjusted by randomly selecting a fixed number of surviving
shrimps. Their growth was estimated by measuring
standard length (from tip of head to posterior margin
of telson). Measurements were made with an eye-piece
micrometer on a stereo microscope Wild 3 to the nearest 0.18 mm. In the first tests, we used culture vessels
with a mesh of 200 J.Lm. At every inspection of survival
and growth, the culture vessels were changed for others with a bigger mesh size (500, 1000 & 2000 J.Lm).
After the first culture period, the cumulative survival
was determined by subtracting the proportional mortality of the actual culture period from the cumulative survival of the foregoing period. The proportional