

94
N
+
0"(\
~
e:CJ
~
.
FENCE
100 m
,
I
I
I
I
I
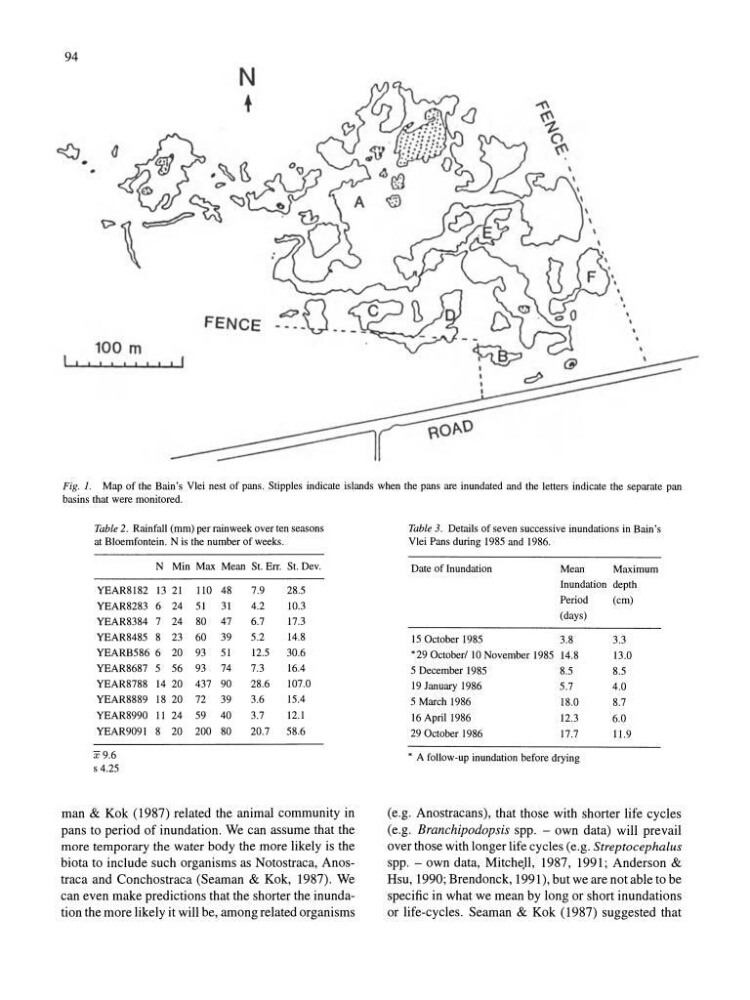
Fig. 1. Map of the Bain's Vlei nest of pans. Stipples indicate islands when the pans are inundated and the letters indicate the separate pan
basins that were monitored.
Table 2. Rainfall (mm) per rainweek over ten seasons
at Bloemfontein. N is the number of weeks.
N Min Max Mean St. Err. St. Dev.
YEAR8182 13 21 110 48
7.9
28.5
YEAR8283 6 24 51
31
4.2
10.3
YEAR8384 7 24 80 47
6.7
17.3
YEAR8485 8 23 60 39
5.2
14.8
YEARB5866 20 93 51
12.5
30.6
YEAR8687 5 56 93 74
7.3
16.4
YEAR8788 14 20 437 90
28.6
107.0
YEAR8889 18 20 72 39
3.6
15.4
YEAR8990 11 24 59 40
3.7
12.1
YEAR9091 8 20 200 80
20.7
58.6
x9.6
s 4.25
man & Kok (1987) related the animal community in
pans to period of inundation. We can assume that the
more temporary the water body the more likely is the
biota to include such organisms as Notostraca, Anostraca and Conchostraca (Seaman & Kok, 1987). We
can even make predictions that the shorter the inundation the more likely it will be, among related organisms
Table 3. Details of seven successive inundations in Bain's
Vlei Pans during 1985 and 1986.
Date of Inundation
Mean
Maximum
Inundation depth
Period
(cm)
(days)
15 October 1985
3.8
3.3
*29 October/l0 November 1985 14.8
13.0
5 December 1985
8.5
8.5
19 January 1986
5.7
4.0
5 March 1986
18.0
8.7
16 April 1986
12.3
6.0
29 October 1986
17.7
11.9
* A follow-up inundation before drying
(e.g. Anostracans), that those with shorter life cycles
(e.g. Branchipodopsis spp. - own data) will prevail
over those with longer life cycles (e.g. Streptocephalus
spp. - own data, Mitcht
specific in what we mean by long or short inundations
or life-cycles. Seaman & Kok (1987) suggested that
N
+
0"(\
~
e:CJ
~
.
FENCE
100 m
,
I
I
I
I
I
Fig. 1. Map of the Bain's Vlei nest of pans. Stipples indicate islands when the pans are inundated and the letters indicate the separate pan
basins that were monitored.
Table 2. Rainfall (mm) per rainweek over ten seasons
at Bloemfontein. N is the number of weeks.
N Min Max Mean St. Err. St. Dev.
YEAR8182 13 21 110 48
7.9
28.5
YEAR8283 6 24 51
31
4.2
10.3
YEAR8384 7 24 80 47
6.7
17.3
YEAR8485 8 23 60 39
5.2
14.8
YEARB5866 20 93 51
12.5
30.6
YEAR8687 5 56 93 74
7.3
16.4
YEAR8788 14 20 437 90
28.6
107.0
YEAR8889 18 20 72 39
3.6
15.4
YEAR8990 11 24 59 40
3.7
12.1
YEAR9091 8 20 200 80
20.7
58.6
x9.6
s 4.25
man & Kok (1987) related the animal community in
pans to period of inundation. We can assume that the
more temporary the water body the more likely is the
biota to include such organisms as Notostraca, Anostraca and Conchostraca (Seaman & Kok, 1987). We
can even make predictions that the shorter the inundation the more likely it will be, among related organisms
Table 3. Details of seven successive inundations in Bain's
Vlei Pans during 1985 and 1986.
Date of Inundation
Mean
Maximum
Inundation depth
Period
(cm)
(days)
15 October 1985
3.8
3.3
*29 October/l0 November 1985 14.8
13.0
5 December 1985
8.5
8.5
19 January 1986
5.7
4.0
5 March 1986
18.0
8.7
16 April 1986
12.3
6.0
29 October 1986
17.7
11.9
* A follow-up inundation before drying
(e.g. Anostracans), that those with shorter life cycles
(e.g. Branchipodopsis spp. - own data) will prevail
over those with longer life cycles (e.g. Streptocephalus
spp. - own data, Mitcht
specific in what we mean by long or short inundations
or life-cycles. Seaman & Kok (1987) suggested that