

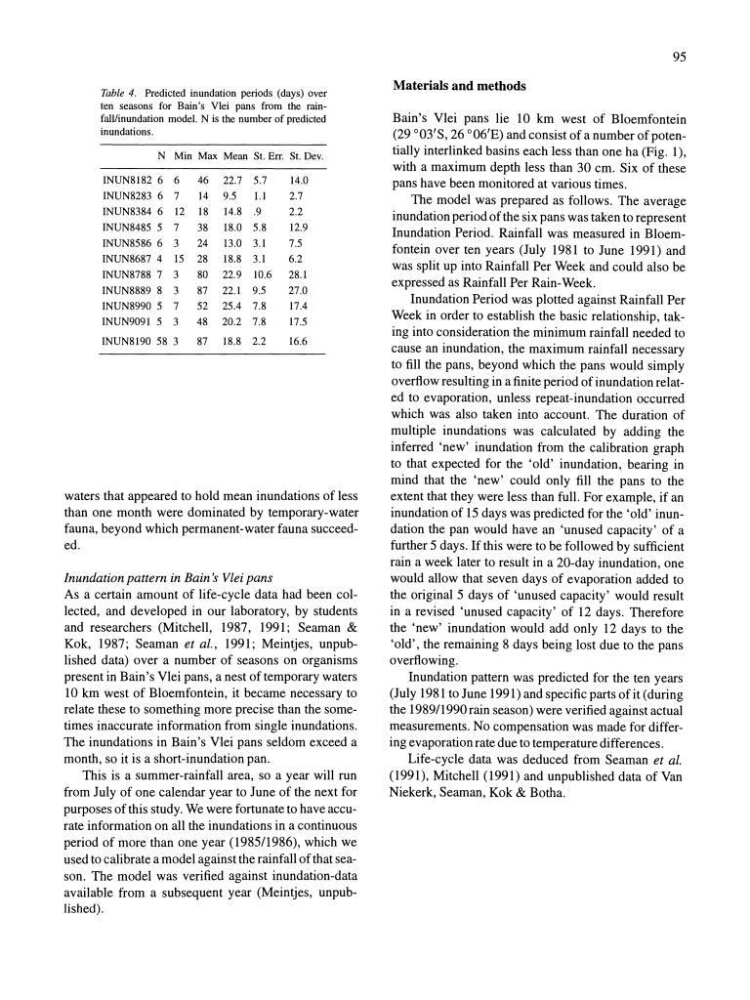
Table 4. Predicted inundation periods (days) over
ten seasons for Bain's Vlei pans from the rainfaiVinundation model. N is the number of predicted
inundations.
N Min Max Mean St. Err. St. Dev.
INUN8182 6 6
46 22.7 5.7
14.0
INUN8283 6 7
14 9.5
1.1
2.7
INUN8384 6 12 18
14.8 .9
2.2
INUN8485 5 7
38
18.0 5.8
12.9
INUN8586 6 3
24
13.0 3.1
7.5
INUN8687 4 15 28
18.8 3.1
6.2
INUN8788 7 3
80 22.9 10.6
28.1
INUN8889 8 3
87 22.1 9.5
27.0
INUN8990 5 7
52 25.4 7.8
17.4
INUN9091 5 3
48 20.2 7.8
17.5
INUN8190 58 3
87
18.8 2.2
16.6
waters that appeared to hold mean inundations of less
than one month were dominated by temporary-water
fauna, beyond which permanent-water fauna succeeded.
Inundation pattern in Rain's Vlei pans
As a certain amount of life-cycle data had been collected, and developed in our laboratory, by students
and researchers (Mitchell, 1987, 1991; Seaman &
Kok, 1987; Seaman et at., 1991; Meintjes, unpublished data) over a number of seasons on organisms
present in Bain's Vlei pans, a nest of temporary waters
10 km west of Bloemfontein, it became necessary to
relate these to something more precise than the sometimes inaccurate information from single inundations.
The inundations in Bain's Vlei pans seldom exceed a
month, so it is a short-inundation pan.
This is a summer-rainfall area, so a year will run
from July of one calendar year to June of the next for
purposes of this study. We were fortunate to have accurate information on all the inundations in a continuous
period of more than one year (1985/1986), which we
used to calibrate a model against the rainfall of that season. The model was verified against inundation-data
available from a subsequent year (Meintjes, unpublished).
95
Materials and methods
Bain's Vlei pans lie 10 km west of Bloemfontein
(29 °03'S, 26 °06'E) and consist of a number of potentially interlinked basins each less than one ha (Fig. 1),
with a maximum depth less than 30 cm. Six of these
pans have been monitored at various times.
The model was prepared as follows. The average
inundation period of the six pans was taken to represent
Inundation Period. Rainfall was measured in Bloemfontein over ten years (July 1981 to June 1991) and
was split up into Rainfall Per Week and could also be
expressed as Rainfall Per Rain-Week.
Inundation Period was plotted against Rainfall Per
Week in order to establish the basic relationship, taking into consideration the minimum rainfall needed to
cause an inundation, the maximum rainfall necessary
to fill the pans, beyond which the pans would simply
overflow resulting in a finite period of inundation related to evaporation, unless repeat-inundation occurred
which was also taken into account. The duration of
multiple inundations was calculated by adding the
inferred 'new' inundation from the calibration graph
to that expected for the 'old' inundation, bearing in
mind that the 'new' could only fill the pans to the
extent that they were less than full. For example, if an
inundation of 15 days was predicted for the 'old' inundation the pan would have an 'unused capacity' of a
further 5 days. If this were to be followed by sufficient
rain a week later to result in a 20-day inundation, one
would allow that seven days of evaporation added to
the original 5 days of 'unused capacity' would result
in a revised 'unused capacity' of 12 days. Therefore
the 'new' inundation would add only 12 days to the
'old', the remaining 8 days being lost due to the pans
overflowing.
Inundation pattern was predicted for the ten years
(July 1981 to June 1991) and specific parts of it (during
the 1989/1990 rain season) were verified against actual
measurements. No compensation was made for differing evaporation rate due to temperature differences.
Life-cycle data was deduced from Seaman et at.
(1991), Mitchell (1991) and unpublished data of Van
Niekerk, Seaman, Kok & Botha.
ten seasons for Bain's Vlei pans from the rainfaiVinundation model. N is the number of predicted
inundations.
N Min Max Mean St. Err. St. Dev.
INUN8182 6 6
46 22.7 5.7
14.0
INUN8283 6 7
14 9.5
1.1
2.7
INUN8384 6 12 18
14.8 .9
2.2
INUN8485 5 7
38
18.0 5.8
12.9
INUN8586 6 3
24
13.0 3.1
7.5
INUN8687 4 15 28
18.8 3.1
6.2
INUN8788 7 3
80 22.9 10.6
28.1
INUN8889 8 3
87 22.1 9.5
27.0
INUN8990 5 7
52 25.4 7.8
17.4
INUN9091 5 3
48 20.2 7.8
17.5
INUN8190 58 3
87
18.8 2.2
16.6
waters that appeared to hold mean inundations of less
than one month were dominated by temporary-water
fauna, beyond which permanent-water fauna succeeded.
Inundation pattern in Rain's Vlei pans
As a certain amount of life-cycle data had been collected, and developed in our laboratory, by students
and researchers (Mitchell, 1987, 1991; Seaman &
Kok, 1987; Seaman et at., 1991; Meintjes, unpublished data) over a number of seasons on organisms
present in Bain's Vlei pans, a nest of temporary waters
10 km west of Bloemfontein, it became necessary to
relate these to something more precise than the sometimes inaccurate information from single inundations.
The inundations in Bain's Vlei pans seldom exceed a
month, so it is a short-inundation pan.
This is a summer-rainfall area, so a year will run
from July of one calendar year to June of the next for
purposes of this study. We were fortunate to have accurate information on all the inundations in a continuous
period of more than one year (1985/1986), which we
used to calibrate a model against the rainfall of that season. The model was verified against inundation-data
available from a subsequent year (Meintjes, unpublished).
95
Materials and methods
Bain's Vlei pans lie 10 km west of Bloemfontein
(29 °03'S, 26 °06'E) and consist of a number of potentially interlinked basins each less than one ha (Fig. 1),
with a maximum depth less than 30 cm. Six of these
pans have been monitored at various times.
The model was prepared as follows. The average
inundation period of the six pans was taken to represent
Inundation Period. Rainfall was measured in Bloemfontein over ten years (July 1981 to June 1991) and
was split up into Rainfall Per Week and could also be
expressed as Rainfall Per Rain-Week.
Inundation Period was plotted against Rainfall Per
Week in order to establish the basic relationship, taking into consideration the minimum rainfall needed to
cause an inundation, the maximum rainfall necessary
to fill the pans, beyond which the pans would simply
overflow resulting in a finite period of inundation related to evaporation, unless repeat-inundation occurred
which was also taken into account. The duration of
multiple inundations was calculated by adding the
inferred 'new' inundation from the calibration graph
to that expected for the 'old' inundation, bearing in
mind that the 'new' could only fill the pans to the
extent that they were less than full. For example, if an
inundation of 15 days was predicted for the 'old' inundation the pan would have an 'unused capacity' of a
further 5 days. If this were to be followed by sufficient
rain a week later to result in a 20-day inundation, one
would allow that seven days of evaporation added to
the original 5 days of 'unused capacity' would result
in a revised 'unused capacity' of 12 days. Therefore
the 'new' inundation would add only 12 days to the
'old', the remaining 8 days being lost due to the pans
overflowing.
Inundation pattern was predicted for the ten years
(July 1981 to June 1991) and specific parts of it (during
the 1989/1990 rain season) were verified against actual
measurements. No compensation was made for differing evaporation rate due to temperature differences.
Life-cycle data was deduced from Seaman et at.
(1991), Mitchell (1991) and unpublished data of Van
Niekerk, Seaman, Kok & Botha.