

98
N. Wesolek et al.
OC curves for the analysis of ONE sample
of a certain number of shellfish
0
0.2
0.4
0.6
0.8
1
135
145
155
165
175
185
195
205
Probability of acceptance
10 shellfish
20 shellfish
30 shellfish
c(µg/kg)
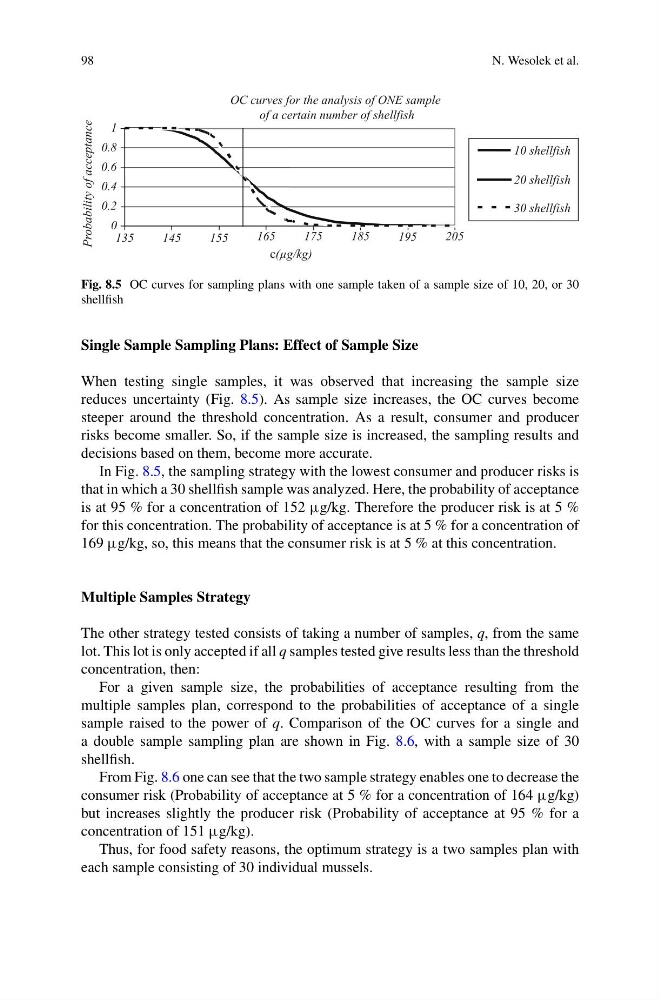
Fig. 8.5 OC curves for sampling plans with one sample taken of a sample size of 10, 20, or 30
shellfish
Single Sample Sampling Plans: Effect of Sample Size
When testing single samples, it was observed that increasing the sample size
reduces uncertainty (Fig. 8.5). As sample size increases, the OC curves become
steeper around the threshold concentration. As a result, consumer and producer
risks become smaller. So, if the sample size is increased, the sampling results and
decisions based on them, become more accurate.
In Fig. 8.5, the sampling strategy with the lowest consumer and producer risks is
that in which a 30 shellfish sample was analyzed. Here, the probability of acceptance
is at 95 % for a concentration of 152 g/kg. Therefore the producer risk is at 5 %
for this concentration. The probability of acceptance is at 5 % for a concentration of
169 g/kg, so, this means that the consumer risk is at 5 % at this concentration.
Multiple Samples Strategy
The other strategy tested consists of taking a number of samples, q, from the same
lot. This lot is only accepted if all q samples tested give results less than the threshold
concentration, then:
For a given sample size, the probabilities of acceptance resulting from the
multiple samples plan, correspond to the probabilities of acceptance of a single
sample raised to the power of q. Comparison of the OC curves for a single and
a double sample sampling plan are shown in Fig. 8.6, with a sample size of 30
shellfish.
From Fig. 8.6 one can see that the two sample strategy enables one to decrease the
consumer risk (Probability of acceptance at 5 % for a concentration of 164 g/kg)
but increases slightly the producer risk (Probability of acceptance at 95 % for a
concentration of 151 g/kg).
Thus, for food safety reasons, the optimum strategy is a two samples plan with
each sample consisting of 30 individual mussels.
N. Wesolek et al.
OC curves for the analysis of ONE sample
of a certain number of shellfish
0
0.2
0.4
0.6
0.8
1
135
145
155
165
175
185
195
205
Probability of acceptance
10 shellfish
20 shellfish
30 shellfish
c(µg/kg)
Fig. 8.5 OC curves for sampling plans with one sample taken of a sample size of 10, 20, or 30
shellfish
Single Sample Sampling Plans: Effect of Sample Size
When testing single samples, it was observed that increasing the sample size
reduces uncertainty (Fig. 8.5). As sample size increases, the OC curves become
steeper around the threshold concentration. As a result, consumer and producer
risks become smaller. So, if the sample size is increased, the sampling results and
decisions based on them, become more accurate.
In Fig. 8.5, the sampling strategy with the lowest consumer and producer risks is
that in which a 30 shellfish sample was analyzed. Here, the probability of acceptance
is at 95 % for a concentration of 152 g/kg. Therefore the producer risk is at 5 %
for this concentration. The probability of acceptance is at 5 % for a concentration of
169 g/kg, so, this means that the consumer risk is at 5 % at this concentration.
Multiple Samples Strategy
The other strategy tested consists of taking a number of samples, q, from the same
lot. This lot is only accepted if all q samples tested give results less than the threshold
concentration, then:
For a given sample size, the probabilities of acceptance resulting from the
multiple samples plan, correspond to the probabilities of acceptance of a single
sample raised to the power of q. Comparison of the OC curves for a single and
a double sample sampling plan are shown in Fig. 8.6, with a sample size of 30
shellfish.
From Fig. 8.6 one can see that the two sample strategy enables one to decrease the
consumer risk (Probability of acceptance at 5 % for a concentration of 164 g/kg)
but increases slightly the producer risk (Probability of acceptance at 95 % for a
concentration of 151 g/kg).
Thus, for food safety reasons, the optimum strategy is a two samples plan with
each sample consisting of 30 individual mussels.