

96
N. Wesolek et al.
Table 8.1 Goodness of fit test results
D calc
Critical
value
p-value (%)
Lot n
ı 1 0.1393 0.2457
57:91
Lot n
ı 2 0.1829 0.2457
25:39
Lot n
ı 3 0.2503 0.2417
3:84
Lot n
ı 4 0.1547 0.2417
42:66
Sampling variance evolution as function of mean concentration
y = 5.387e
0.0311x
R 2 = 0.4189
0
10000
20000
30000
40000
0
50
100
150
200
250
300
c (µg/kg)
S
2
s
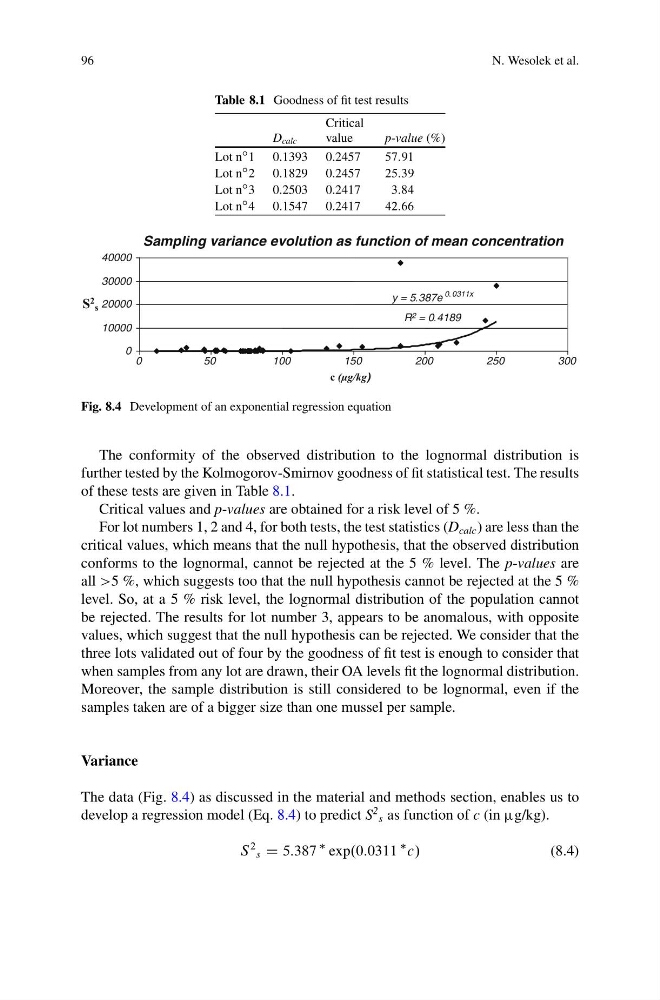
Fig. 8.4 Development of an exponential regression equation
The conformity of the observed distribution to the lognormal distribution is
further tested by the Kolmogorov-Smirnov goodness of fit statistical test. The results
of these tests are given in Table 8.1.
Critical values and p-values are obtained for a risk level of 5 %.
For lot numbers 1, 2 and 4, for both tests, the test statistics (D calc ) are less than the
critical values, which means that the null hypothesis, that the observed distribution
conforms to the lognormal, cannot be rejected at the 5 % level. The p-values are
all >5 %, which suggests too that the null hypothesis cannot be rejected at the 5 %
level. So, at a 5 % risk level, the lognormal distribution of the population cannot
be rejected. The results for lot number 3, appears to be anomalous, with opposite
values, which suggest that the null hypothesis can be rejected. We consider that the
three lots validated out of four by the goodness of fit test is enough to consider that
when samples from any lot are drawn, their OA levels fit the lognormal distribution.
Moreover, the sample distribution is still considered to be lognormal, even if the
samples taken are of a bigger size than one mussel per sample.
Variance
The data (Fig. 8.4) as discussed in the material and methods section, enables us to
develop a regression model (Eq. 8.4) to predict S
2
s as function of c (in g/kg).
S
2 s D 5:387
exp.0:0311
c/
(8.4)
N. Wesolek et al.
Table 8.1 Goodness of fit test results
D calc
Critical
value
p-value (%)
Lot n
ı 1 0.1393 0.2457
57:91
Lot n
ı 2 0.1829 0.2457
25:39
Lot n
ı 3 0.2503 0.2417
3:84
Lot n
ı 4 0.1547 0.2417
42:66
Sampling variance evolution as function of mean concentration
y = 5.387e
0.0311x
R 2 = 0.4189
0
10000
20000
30000
40000
0
50
100
150
200
250
300
c (µg/kg)
S
2
s
Fig. 8.4 Development of an exponential regression equation
The conformity of the observed distribution to the lognormal distribution is
further tested by the Kolmogorov-Smirnov goodness of fit statistical test. The results
of these tests are given in Table 8.1.
Critical values and p-values are obtained for a risk level of 5 %.
For lot numbers 1, 2 and 4, for both tests, the test statistics (D calc ) are less than the
critical values, which means that the null hypothesis, that the observed distribution
conforms to the lognormal, cannot be rejected at the 5 % level. The p-values are
all >5 %, which suggests too that the null hypothesis cannot be rejected at the 5 %
level. So, at a 5 % risk level, the lognormal distribution of the population cannot
be rejected. The results for lot number 3, appears to be anomalous, with opposite
values, which suggest that the null hypothesis can be rejected. We consider that the
three lots validated out of four by the goodness of fit test is enough to consider that
when samples from any lot are drawn, their OA levels fit the lognormal distribution.
Moreover, the sample distribution is still considered to be lognormal, even if the
samples taken are of a bigger size than one mussel per sample.
Variance
The data (Fig. 8.4) as discussed in the material and methods section, enables us to
develop a regression model (Eq. 8.4) to predict S
2
s as function of c (in g/kg).
S
2 s D 5:387
exp.0:0311
c/
(8.4)