

94
N. Wesolek et al.
0
0.2
0.4
0.6
0.8
1
Contaminant content
Probability of acceptance
Regulation limit
Producer risk
Consumer risk
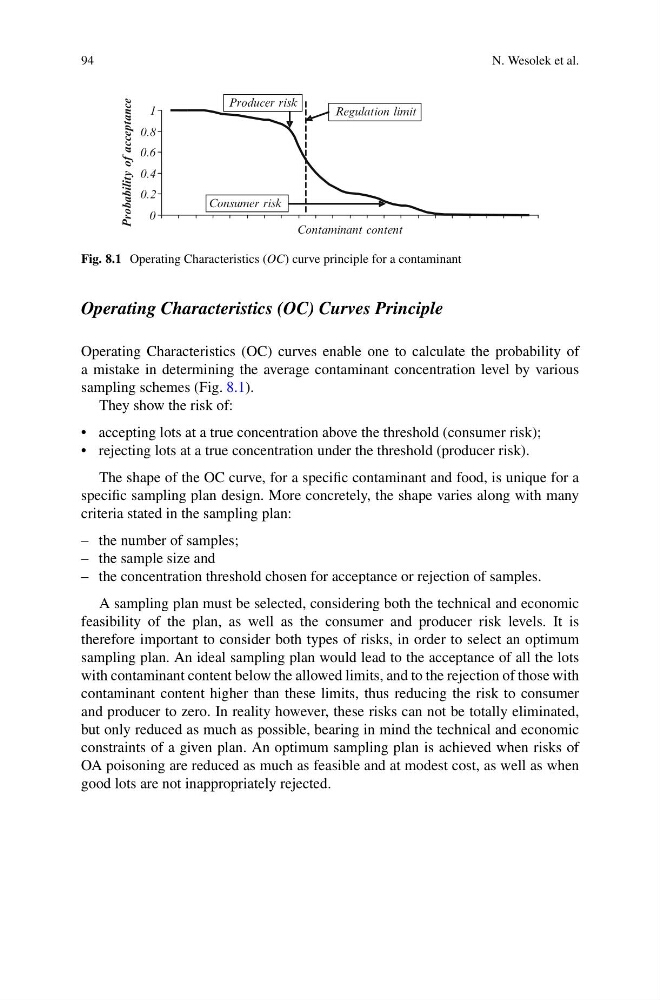
Fig. 8.1 Operating Characteristics (OC) curve principle for a contaminant
Operating Characteristics (OC) Curves Principle
Operating Characteristics (OC) curves enable one to calculate the probability of
a mistake in determining the average contaminant concentration level by various
sampling schemes (Fig. 8.1).
They show the risk of:
• accepting lots at a true concentration above the threshold (consumer risk);
• rejecting lots at a true concentration under the threshold (producer risk).
The shape of the OC curve, for a specific contaminant and food, is unique for a
specific sampling plan design. More concretely, the shape varies along with many
criteria stated in the sampling plan:
– the number of samples;
– the sample size and
– the concentration threshold chosen for acceptance or rejection of samples.
A sampling plan must be selected, considering both the technical and economic
feasibility of the plan, as well as the consumer and producer risk levels. It is
therefore important to consider both types of risks, in order to select an optimum
sampling plan. An ideal sampling plan would lead to the acceptance of all the lots
with contaminant content below the allowed limits, and to the rejection of those with
contaminant content higher than these limits, thus reducing the risk to consumer
and producer to zero. In reality however, these risks can not be totally eliminated,
but only reduced as much as possible, bearing in mind the technical and economic
constraints of a given plan. An optimum sampling plan is achieved when risks of
OA poisoning are reduced as much as feasible and at modest cost, as well as when
good lots are not inappropriately rejected.
N. Wesolek et al.
0
0.2
0.4
0.6
0.8
1
Contaminant content
Probability of acceptance
Regulation limit
Producer risk
Consumer risk
Fig. 8.1 Operating Characteristics (OC) curve principle for a contaminant
Operating Characteristics (OC) Curves Principle
Operating Characteristics (OC) curves enable one to calculate the probability of
a mistake in determining the average contaminant concentration level by various
sampling schemes (Fig. 8.1).
They show the risk of:
• accepting lots at a true concentration above the threshold (consumer risk);
• rejecting lots at a true concentration under the threshold (producer risk).
The shape of the OC curve, for a specific contaminant and food, is unique for a
specific sampling plan design. More concretely, the shape varies along with many
criteria stated in the sampling plan:
– the number of samples;
– the sample size and
– the concentration threshold chosen for acceptance or rejection of samples.
A sampling plan must be selected, considering both the technical and economic
feasibility of the plan, as well as the consumer and producer risk levels. It is
therefore important to consider both types of risks, in order to select an optimum
sampling plan. An ideal sampling plan would lead to the acceptance of all the lots
with contaminant content below the allowed limits, and to the rejection of those with
contaminant content higher than these limits, thus reducing the risk to consumer
and producer to zero. In reality however, these risks can not be totally eliminated,
but only reduced as much as possible, bearing in mind the technical and economic
constraints of a given plan. An optimum sampling plan is achieved when risks of
OA poisoning are reduced as much as feasible and at modest cost, as well as when
good lots are not inappropriately rejected.