

36
Algae and Nutrients: Uptake and Utilization of Limiting ...
o
•
•
•
d
00
--0
d
•
•
.0
0
d
lE ro
0..
· 0
't:I
(!)
--;
u
0
IZl
0
0
1
Scaled P quota (Q - Q')/(Q" - Q')
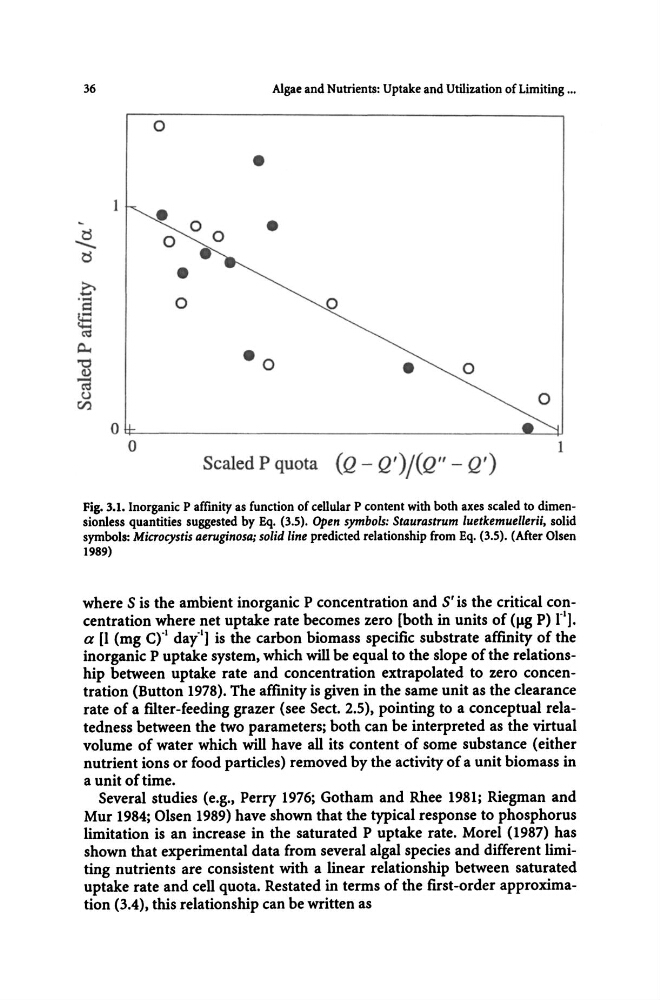
Fig. 3.1. Inorganic P affinity as function of cellular P content with both axes scaled to dimensionless quantities suggested by Eq. (3.5). Open symbols: Staurastrum luetkemuellerii, solid
symbols: Microcystis aeruginosa; solid line predicted relationship from Eq. (3.S). (After Olsen
1989)
where S is the ambient inorganic P concentration and S'is the critical concentration where net uptake rate becomes zero [both in units of (Ilg P) }"I].
a [I (mg C).I day·l] is the carbon biomass specific substrate affinity of the
inorganic P uptake system, which will be equal to the slope of the relationship between uptake rate and concentration extrapolated to zero concentration (Button 1978). The affinity is given in the same unit as the clearance
rate of a filter-feeding grazer (see Sect. 2.5), pointing to a conceptual relatedness between the two parameters; both can be interpreted as the virtual
volume of water which will have all its content of some substance (either
nutrient ions or food particles) removed by the activity of a unit biomass in
a unit of time.
Several studies (e.g., Perry 1976; Gotham and Rhee 1981; Riegman and
Mur 1984; Olsen 1989) have shown that the typical response to phosphorus
limitation is an increase in the saturated P uptake rate. Morel (1987) has
shown that experimental data from several algal species and different limiting nutrients are consistent with a linear relationship between saturated
uptake rate and cell quota. Restated in terms of the first-order approximation (3.4), this relationship can be written as
Algae and Nutrients: Uptake and Utilization of Limiting ...
o
•
•
•
d
00
--0
d
•
•
.0
0
d
lE ro
0..
· 0
't:I
(!)
--;
u
0
IZl
0
0
1
Scaled P quota (Q - Q')/(Q" - Q')
Fig. 3.1. Inorganic P affinity as function of cellular P content with both axes scaled to dimensionless quantities suggested by Eq. (3.5). Open symbols: Staurastrum luetkemuellerii, solid
symbols: Microcystis aeruginosa; solid line predicted relationship from Eq. (3.S). (After Olsen
1989)
where S is the ambient inorganic P concentration and S'is the critical concentration where net uptake rate becomes zero [both in units of (Ilg P) }"I].
a [I (mg C).I day·l] is the carbon biomass specific substrate affinity of the
inorganic P uptake system, which will be equal to the slope of the relationship between uptake rate and concentration extrapolated to zero concentration (Button 1978). The affinity is given in the same unit as the clearance
rate of a filter-feeding grazer (see Sect. 2.5), pointing to a conceptual relatedness between the two parameters; both can be interpreted as the virtual
volume of water which will have all its content of some substance (either
nutrient ions or food particles) removed by the activity of a unit biomass in
a unit of time.
Several studies (e.g., Perry 1976; Gotham and Rhee 1981; Riegman and
Mur 1984; Olsen 1989) have shown that the typical response to phosphorus
limitation is an increase in the saturated P uptake rate. Morel (1987) has
shown that experimental data from several algal species and different limiting nutrients are consistent with a linear relationship between saturated
uptake rate and cell quota. Restated in terms of the first-order approximation (3.4), this relationship can be written as