

Survival Curves and Mortality Rates
239
l+---------------------·--------~----~~--~
o~----------------------------~--------~
o
K* 2
Relative food P content (QIO)
1
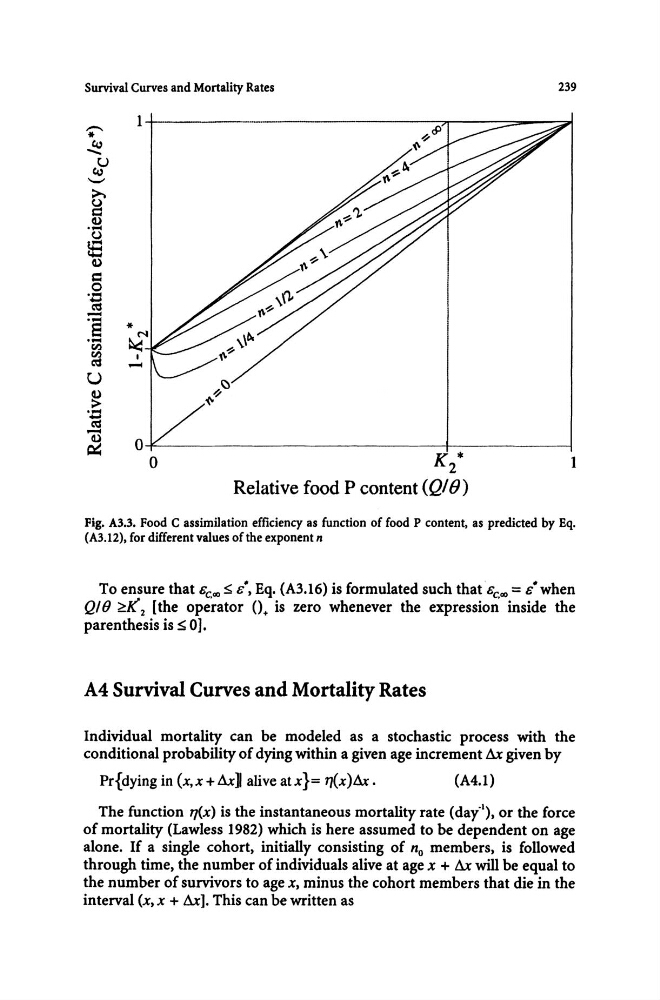
Fig. A3.3. Food C assimilation efficiency as function of food P content, as predicted by Eq.
(A3.l2), for different values of the exponent n
To ensure that se ... ~ s-, Eq. (A3.16) is formulated such thats c , ... = s- when
QI(} ~[(2 [the operator 0+ is zero whenever the expression inside the
parenthesis is ~ 0].
A4 Survival Curves and Mortality Rates
Individual mortality can be modeled as a stochastic process with the
conditional probability of dying within a given age increment IU given by
Pr{dying in (x, x + Ax] alive atx}= 7l(x)~.
(A4.1)
The function 11
alone. If a single cohort, initially consisting of no members, is followed
through time, the number of individuals alive at age x + IU will be equal to
the number of survivors to age x, minus the cohort members that die in the
interval (x, x + IU]. This can be written as
239
l+---------------------·--------~----~~--~
o~----------------------------~--------~
o
K* 2
Relative food P content (QIO)
1
Fig. A3.3. Food C assimilation efficiency as function of food P content, as predicted by Eq.
(A3.l2), for different values of the exponent n
To ensure that se ... ~ s-, Eq. (A3.16) is formulated such thats c , ... = s- when
QI(} ~[(2 [the operator 0+ is zero whenever the expression inside the
parenthesis is ~ 0].
A4 Survival Curves and Mortality Rates
Individual mortality can be modeled as a stochastic process with the
conditional probability of dying within a given age increment IU given by
Pr{dying in (x, x + Ax] alive atx}= 7l(x)~.
(A4.1)
The function 11
alone. If a single cohort, initially consisting of no members, is followed
through time, the number of individuals alive at age x + IU will be equal to
the number of survivors to age x, minus the cohort members that die in the
interval (x, x + IU]. This can be written as