

238
Appendices
1
,-....
u
~
-
n = 118
~
~ ....
= 0
',::1
~
Q
~
Q.)
~
Q.)
>
',::1
d
n=8
- ~
0
0
1
Relative food P content (Qt e )
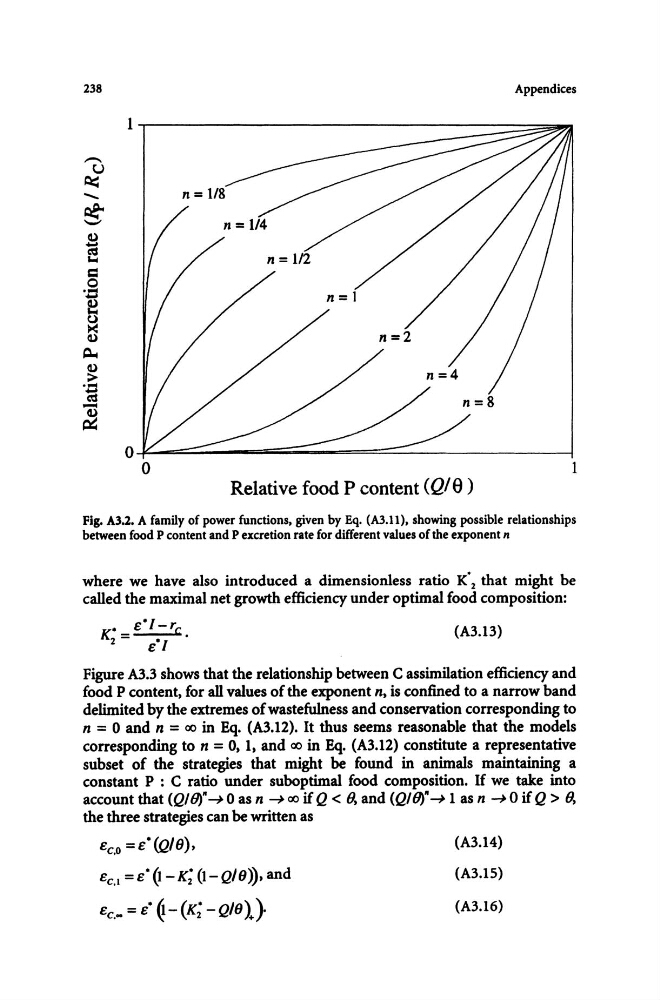
Fig. A3.2. A family of power functions, given by Eq. (A3.II), showing possible relationships
between food P content and P excretion rate for different values of the exponent n
where we have also introduced a dimensionless ratio K' 2 that might be
called the maximal net growth efficiency under optimal food composition:
K" = e"/ -r,.
2
e" /
(A3.13)
Figure A3.3 shows that the relationship between C assimilation efficiency and
food P content, for all values of the exponent n, is confined to a narrow band
delimited by the extremes of wastefulness and conservation corresponding to
n = 0 and n = ex> in Eq. (A3.12). It thus seems reasonable that the models
corresponding to n = 0, 1, and ex> in Eq. (A3.12) constitute a representative
subset of the strategies that might be found in animals maintaining a
constant P : C ratio under suboptimal food composition. If we take into
account that (QI 0)" -+ 0 as n -+ ex> if Q < B, and (QI 0)" -+ 1 as n -+ 0 if Q > B,
the three strategies can be written as
e c . o =e"(Q/8),
e C • 1 = e" (1- K; (1- Q/8», and
ec._ = e" € -(K; - Q/8l)
(A3.14)
(A3.1S)
(A3.16)
Appendices
1
,-....
u
~
-
n = 118
~
~ ....
= 0
',::1
~
Q
~
Q.)
~
Q.)
>
',::1
d
n=8
- ~
0
0
1
Relative food P content (Qt e )
Fig. A3.2. A family of power functions, given by Eq. (A3.II), showing possible relationships
between food P content and P excretion rate for different values of the exponent n
where we have also introduced a dimensionless ratio K' 2 that might be
called the maximal net growth efficiency under optimal food composition:
K" = e"/ -r,.
2
e" /
(A3.13)
Figure A3.3 shows that the relationship between C assimilation efficiency and
food P content, for all values of the exponent n, is confined to a narrow band
delimited by the extremes of wastefulness and conservation corresponding to
n = 0 and n = ex> in Eq. (A3.12). It thus seems reasonable that the models
corresponding to n = 0, 1, and ex> in Eq. (A3.12) constitute a representative
subset of the strategies that might be found in animals maintaining a
constant P : C ratio under suboptimal food composition. If we take into
account that (QI 0)" -+ 0 as n -+ ex> if Q < B, and (QI 0)" -+ 1 as n -+ 0 if Q > B,
the three strategies can be written as
e c . o =e"(Q/8),
e C • 1 = e" (1- K; (1- Q/8», and
ec._ = e" € -(K; - Q/8l)
(A3.14)
(A3.1S)
(A3.16)