

200
Approaching Planktonic Food Webs: Competition. Coexistence. and Chaos
----- 0.3
//-~--,
....
~
......
I G{'i\'Le{'i>
;..::::l
,.........
____ .-1
U
bJ:) 0.2
/ -
E
--...
'"-'
til
til
~
S
0
.- ..0 0.1
Q
0
..0
~
U
0.0
-
1-I
0.0
0.1
0.2
0.3
0.4
0.5
P loading rate ([)..lg P] liter -I d -I)
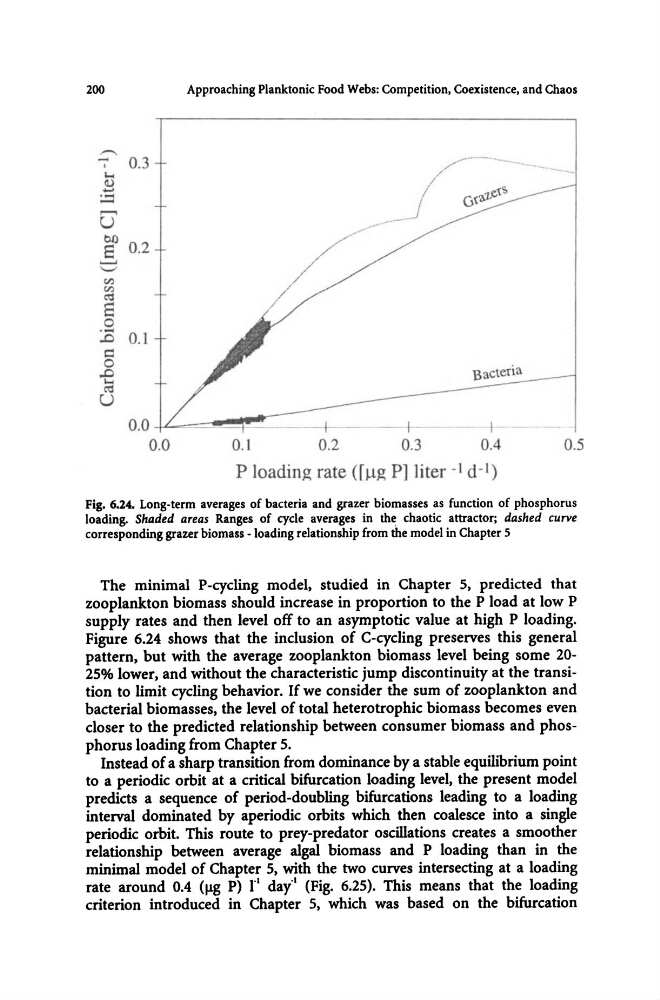
Fig. 6.24. Long-term averages of bacteria and grazer biomasses as function of phosphorus
loading. Shaded areas Ranges of cycle averages in the chaotic attractor; dashed curve
corresponding grazer biomass -loading relationship from the model in Chapter 5
The minimal P-cycling model, studied in Chapter 5, predicted that
zooplankton biomass should increase in proportion to the P load at low P
supply rates and then level off to an asymptotic value at high P loading.
Figure 6.24 shows that the inclusion of C-cycling preserves this general
pattern, but with the average zooplankton biomass level being some 2025% lower, and without the characteristic jump discontinuity at the transition to limit cycling behavior. If we consider the sum of zooplankton and
bacterial biomasses, the level of total heterotrophic biomass becomes even
closer to the predicted relationship between consumer biomass and phosphorus loading from Chapter 5.
Instead of a sharp transition from dominance by a stable equilibrium point
to a periodic orbit at a critical bifurcation loading level, the present model
predicts a sequence of period-doubling bifurcations leading to a loading
interval dominated by aperiodic orbits which then coalesce into a single
periodic orbit. This route to prey-predator oscillations creates a smoother
relationship between average algal biomass and P loading than in the
minimal model of Chapter 5, with the two curves intersecting at a loading
rate around 0.4 (~ P) r
l day"1 (Fig. 6.25). This means that the loading
criterion introduced in Chapter 5, which was based on the bifurcation
Approaching Planktonic Food Webs: Competition. Coexistence. and Chaos
----- 0.3
//-~--,
....
~
......
I G{'i\'Le{'i>
;..::::l
,.........
____ .-1
U
bJ:) 0.2
/ -
E
--...
'"-'
til
til
~
S
0
.- ..0 0.1
Q
0
..0
~
U
0.0
-
1-I
0.0
0.1
0.2
0.3
0.4
0.5
P loading rate ([)..lg P] liter -I d -I)
Fig. 6.24. Long-term averages of bacteria and grazer biomasses as function of phosphorus
loading. Shaded areas Ranges of cycle averages in the chaotic attractor; dashed curve
corresponding grazer biomass -loading relationship from the model in Chapter 5
The minimal P-cycling model, studied in Chapter 5, predicted that
zooplankton biomass should increase in proportion to the P load at low P
supply rates and then level off to an asymptotic value at high P loading.
Figure 6.24 shows that the inclusion of C-cycling preserves this general
pattern, but with the average zooplankton biomass level being some 2025% lower, and without the characteristic jump discontinuity at the transition to limit cycling behavior. If we consider the sum of zooplankton and
bacterial biomasses, the level of total heterotrophic biomass becomes even
closer to the predicted relationship between consumer biomass and phosphorus loading from Chapter 5.
Instead of a sharp transition from dominance by a stable equilibrium point
to a periodic orbit at a critical bifurcation loading level, the present model
predicts a sequence of period-doubling bifurcations leading to a loading
interval dominated by aperiodic orbits which then coalesce into a single
periodic orbit. This route to prey-predator oscillations creates a smoother
relationship between average algal biomass and P loading than in the
minimal model of Chapter 5, with the two curves intersecting at a loading
rate around 0.4 (~ P) r
l day"1 (Fig. 6.25). This means that the loading
criterion introduced in Chapter 5, which was based on the bifurcation