

The Fate of Zooplankton Egesta: Carbon Cycling and Chaos
193
attractor over the major part of the loading gradient. Taking long-term
averages over the periodic orbits, we can illustrate some general properties
of the system by considering the partitioning of total phosphorus and
organic carbon as functions ofP loading (Figs. 6.23 and 6.24).
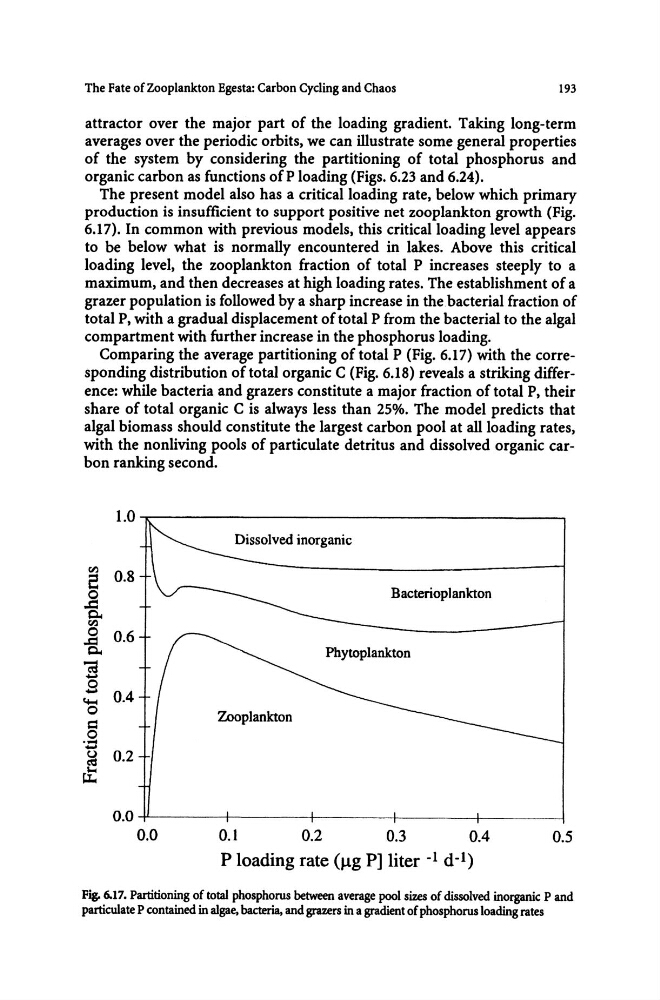
The present model also has a critical loading rate, below which primary
production is insufficient to support positive net zooplankton growth (Fig.
6.17). In common with previous models, this critical loading level appears
to be below what is normally encountered in lakes. Above this critical
loading level, the zooplankton fraction of total P increases steeply to a
maximum, and then decreases at high loading rates. The establishment of a
grazer population is followed by a sharp increase in the bacterial fraction of
total P, with a gradual displacement of total P from the bacterial to the algal
compartment with further increase in the phosphorus loading.
Comparing the average partitioning of total p (Fig. 6.17) with the corresponding distribution of total organic C (Fig. 6.18) reveals a striking difference: while bacteria and grazers constitute a major fraction of total P, their
share of total organic C is always less than 25%. The model predicts that
algal biomass should constitute the largest carbon pool at all loading rates,
with the nonliving pools of particulate detritus and dissolved organic carbon ranking second.
1.0
Dissolved inorganic
til
e 0.8
0
Bacterioplankton
..c:
0..
til
0
0.6
-a
Phytoplankton
";i
.....
0
..... 0.4
(+-;
0
Zooplankton
=
0
..... .....
~ 0.2
u:
0.0
0.0
0.1
0.2
0.3
0.4
0.5
P loading rate (J.1g P] liter -1 d- 1 )
Fig. 6.17. Partitioning of total phosphorus between average pool sizes of dissolved inorganic P and
particulate P contained in algae, bacteria, and grazers in a gradient of phosphorus loading rates
193
attractor over the major part of the loading gradient. Taking long-term
averages over the periodic orbits, we can illustrate some general properties
of the system by considering the partitioning of total phosphorus and
organic carbon as functions ofP loading (Figs. 6.23 and 6.24).
The present model also has a critical loading rate, below which primary
production is insufficient to support positive net zooplankton growth (Fig.
6.17). In common with previous models, this critical loading level appears
to be below what is normally encountered in lakes. Above this critical
loading level, the zooplankton fraction of total P increases steeply to a
maximum, and then decreases at high loading rates. The establishment of a
grazer population is followed by a sharp increase in the bacterial fraction of
total P, with a gradual displacement of total P from the bacterial to the algal
compartment with further increase in the phosphorus loading.
Comparing the average partitioning of total p (Fig. 6.17) with the corresponding distribution of total organic C (Fig. 6.18) reveals a striking difference: while bacteria and grazers constitute a major fraction of total P, their
share of total organic C is always less than 25%. The model predicts that
algal biomass should constitute the largest carbon pool at all loading rates,
with the nonliving pools of particulate detritus and dissolved organic carbon ranking second.
1.0
Dissolved inorganic
til
e 0.8
0
Bacterioplankton
..c:
0..
til
0
0.6
-a
Phytoplankton
";i
.....
0
..... 0.4
(+-;
0
Zooplankton
=
0
..... .....
~ 0.2
u:
0.0
0.0
0.1
0.2
0.3
0.4
0.5
P loading rate (J.1g P] liter -1 d- 1 )
Fig. 6.17. Partitioning of total phosphorus between average pool sizes of dissolved inorganic P and
particulate P contained in algae, bacteria, and grazers in a gradient of phosphorus loading rates