

Differential Loss Rates and Invadability of Equilibria
175
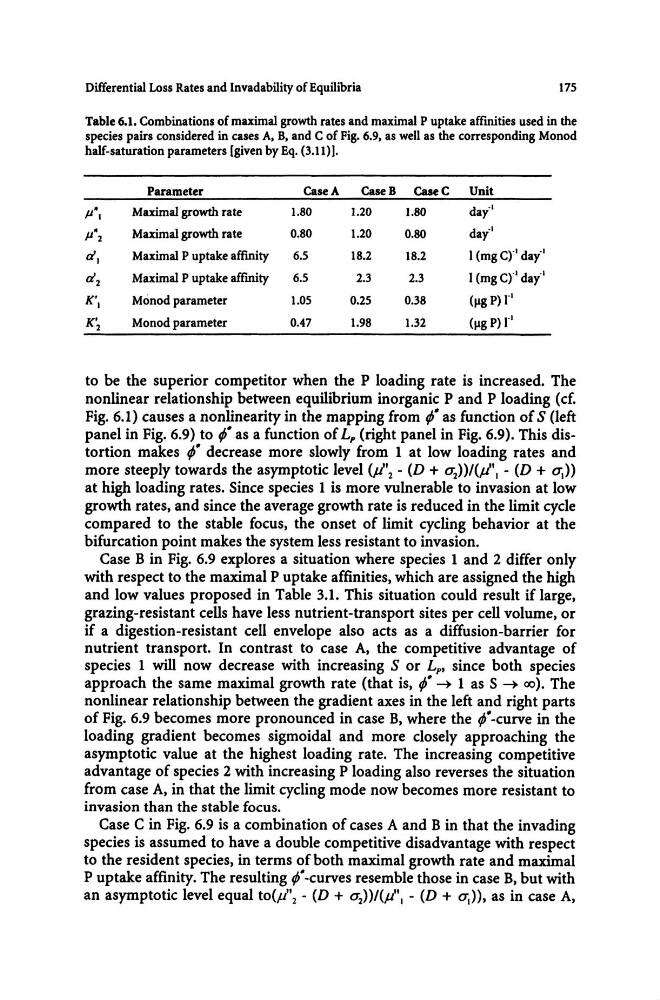
Table 6.1. Combinations of maximal growth rates and maximal P uptake affmities used in the
species pairs considered in cases A. B. and C of Fig. 6.9. as well as the corresponding Monod
half-saturation parameters (given by Eq. (3.11)].
Parameter
Case A
CaseB Casec Unit
p",
Maximal growth rate
1.80
1.20
1.80
day-I
P"2
Maximal growth rate
0.80
1.20
0.80
dati
til
Maximal P uptake affmity
6.5
18.2
18.2
I {mg Cr l day-I
ti2
Maximal P uptake affmity
6.5
2.3
2.3
I {mg C)-I dati
X' , Monod parameter
1.05
0.25
0.38
(f.lgP) r l
X' 2
Monod parameter
0.47
1.98
1.32
(f.lg P) r
l
to be the superior competitor when the P loading rate is increased. The
nonlinear relationship between equilibrium inorganic P and P loading (d.
Fig. 6.1) causes a nonlinearity in the mapping from ;- as function of S (left
panel in Fig. 6.9) to ;- as a function of L, (right panel in Fig. 6.9). This distortion makes ;- decrease more slowly from 1 at low loading rates and
more steeply towards the asymptotic level
growth rates. and since the average growth rate is reduced in the limit cycle
compared to the stable focus. the onset of limit cycling behavior at the
bifurcation point makes the system less resistant to invasion.
Case B in Fig. 6.9 explores a situation where species 1 and 2 differ only
with respect to the maximal P uptake affinities. which are assigned the high
and low values proposed in Table 3.1. This situation could result if large.
grazing-resistant cells have less nutrient-transport sites per cell volume. or
if a digestion-resistant cell envelope also acts as a diffusion-barrier for
nutrient transport. In contrast to case A. the competitive advantage of
species 1 will now decrease with increasing S or L,. since both species
approach the same maximal growth rate (that is. ;* ~ 1 as S ~ 00). The
nonlinear relationship between the gradient axes in the left and right parts
of Fig. 6.9 becomes more pronounced in case B. where the ;--curve in the
loading gradient becomes sigmoidal and more closely approaching the
asymptotic value at the highest loading rate. The increasing competitive
advantage of species 2 with increasing P loading also reverses the situation
from case A. in that the limit cycling mode now becomes more resistant to
invasion than the stable focus.
Case C in Fig. 6.9 is a combination of cases A and B in that the invading
species is assumed to have a double competitive disadvantage with respect
to the resident species. in terms of both maximal growth rate and maximal
P uptake affinity. The resulting ;*-curves resemble those in case B. but with
an asymptotic level equal to(P'2 - (D + UZ»/(p', - (D + 0",». as in case A.
175
Table 6.1. Combinations of maximal growth rates and maximal P uptake affmities used in the
species pairs considered in cases A. B. and C of Fig. 6.9. as well as the corresponding Monod
half-saturation parameters (given by Eq. (3.11)].
Parameter
Case A
CaseB Casec Unit
p",
Maximal growth rate
1.80
1.20
1.80
day-I
P"2
Maximal growth rate
0.80
1.20
0.80
dati
til
Maximal P uptake affmity
6.5
18.2
18.2
I {mg Cr l day-I
ti2
Maximal P uptake affmity
6.5
2.3
2.3
I {mg C)-I dati
X' , Monod parameter
1.05
0.25
0.38
(f.lgP) r l
X' 2
Monod parameter
0.47
1.98
1.32
(f.lg P) r
l
to be the superior competitor when the P loading rate is increased. The
nonlinear relationship between equilibrium inorganic P and P loading (d.
Fig. 6.1) causes a nonlinearity in the mapping from ;- as function of S (left
panel in Fig. 6.9) to ;- as a function of L, (right panel in Fig. 6.9). This distortion makes ;- decrease more slowly from 1 at low loading rates and
more steeply towards the asymptotic level
growth rates. and since the average growth rate is reduced in the limit cycle
compared to the stable focus. the onset of limit cycling behavior at the
bifurcation point makes the system less resistant to invasion.
Case B in Fig. 6.9 explores a situation where species 1 and 2 differ only
with respect to the maximal P uptake affinities. which are assigned the high
and low values proposed in Table 3.1. This situation could result if large.
grazing-resistant cells have less nutrient-transport sites per cell volume. or
if a digestion-resistant cell envelope also acts as a diffusion-barrier for
nutrient transport. In contrast to case A. the competitive advantage of
species 1 will now decrease with increasing S or L,. since both species
approach the same maximal growth rate (that is. ;* ~ 1 as S ~ 00). The
nonlinear relationship between the gradient axes in the left and right parts
of Fig. 6.9 becomes more pronounced in case B. where the ;--curve in the
loading gradient becomes sigmoidal and more closely approaching the
asymptotic value at the highest loading rate. The increasing competitive
advantage of species 2 with increasing P loading also reverses the situation
from case A. in that the limit cycling mode now becomes more resistant to
invasion than the stable focus.
Case C in Fig. 6.9 is a combination of cases A and B in that the invading
species is assumed to have a double competitive disadvantage with respect
to the resident species. in terms of both maximal growth rate and maximal
P uptake affinity. The resulting ;*-curves resemble those in case B. but with
an asymptotic level equal to(P'2 - (D + UZ»/(p', - (D + 0",». as in case A.