

174
Approaching Planktonic Food Webs: Competition, Coexistence, and Chaos
1.0
I.S
III
0.8
1.0
q,0,6
,JOIiUtlant
112
0.4
0.5
a
...
0.2 ~
" ...
'"
0 ,0
0.0 " no
B
------<>
1.5
co.
~
/ -
<
,/
0.8 ~.
:::!.
--0
<)
-"
~ 1.0
Ill ~'
Spe 'i ts I
0.6 '"
..,
..c
dominant
"
.. -
n.
~
"
0
Specie.< 2
0.4 '"
..
~\omtnan(
'"
~
112
q,>
' "'
0.5
~
to::
0.2
.,
'0
co.
..,
<
Q,
"
II)
0.0 0
0.0
~
1.5
"
"
0.8 ,i'
'"
1.0
0.6
Species I
04
-=---=
dominant
0 ,5
----q,~
~q,~1
Speci .. 2
0.2
domin.",
0.0
I
0.0
0
2
4
0,0
0,2
0.4
Inorganic P «lIg PJliter")
P loading rate ([Ilg PJliter " dol)
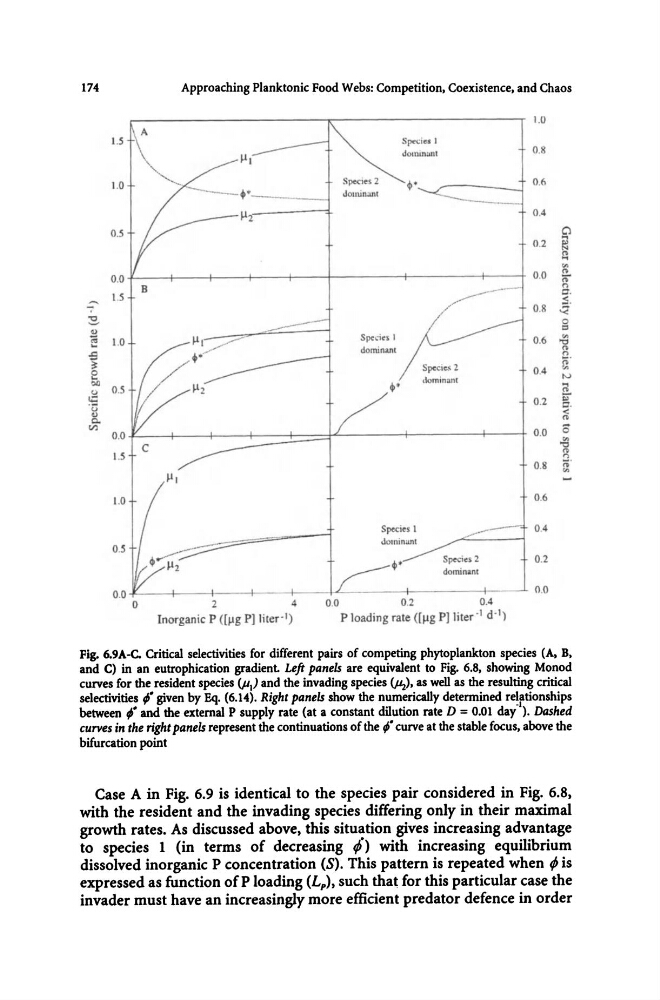
Fig. 6.9A-C. Critical selectivities for different pairs of competing phytoplankton species (A, B,
and C) in an eutrophication gradient. Left panels are equivalent to Fig. 6.8, showing Monod
curves for the resident species (P,) and the invading species
between ;' and the external P supply rate (at a constant dilution rate D = 0.01 day'\ Dashed
curves in the right panels represent the continuations of the ;' curve at the stable focus, above the
bifurcation point
Case A in Fig. 6.9 is identical to the species pair considered in Fig. 6.8,
with the resident and the invading species differing only in their maximal
growth rates. As discussed above, this situation gives increasing advantage
to species 1 (in terms of decreasing (l) with increasing equilibrium
dissolved inorganic P concentration (S). This pattern is repeated when tP is
expressed as function of P loading (Lp), such that for this particular case the
invader must have an increasingly more efficient predator defence in order
Approaching Planktonic Food Webs: Competition, Coexistence, and Chaos
1.0
I.S
III
0.8
1.0
q,0,6
,JOIiUtlant
112
0.4
0.5
a
...
0.2 ~
" ...
'"
0 ,0
0.0 " no
B
------<>
1.5
co.
~
/ -
<
,/
0.8 ~.
:::!.
--0
<)
-"
~ 1.0
Ill ~'
Spe 'i ts I
0.6 '"
..,
..c
dominant
"
.. -
n.
~
"
0
Specie.< 2
0.4 '"
..
~\omtnan(
'"
~
112
q,>
' "'
0.5
~
to::
0.2
.,
'0
co.
..,
<
Q,
"
II)
0.0 0
0.0
~
1.5
"
"
0.8 ,i'
'"
1.0
0.6
Species I
04
-=---=
dominant
0 ,5
----q,~
~q,~1
Speci .. 2
0.2
domin.",
0.0
I
0.0
0
2
4
0,0
0,2
0.4
Inorganic P «lIg PJliter")
P loading rate ([Ilg PJliter " dol)
Fig. 6.9A-C. Critical selectivities for different pairs of competing phytoplankton species (A, B,
and C) in an eutrophication gradient. Left panels are equivalent to Fig. 6.8, showing Monod
curves for the resident species (P,) and the invading species
between ;' and the external P supply rate (at a constant dilution rate D = 0.01 day'\ Dashed
curves in the right panels represent the continuations of the ;' curve at the stable focus, above the
bifurcation point
Case A in Fig. 6.9 is identical to the species pair considered in Fig. 6.8,
with the resident and the invading species differing only in their maximal
growth rates. As discussed above, this situation gives increasing advantage
to species 1 (in terms of decreasing (l) with increasing equilibrium
dissolved inorganic P concentration (S). This pattern is repeated when tP is
expressed as function of P loading (Lp), such that for this particular case the
invader must have an increasingly more efficient predator defence in order