

176
Approaching Planktonic Food Webs: Competition, Coexistence, and Chaos
instead of 1, as in case B. Balancing the competitive advantage of species 1
between high and low nutrient levels gives less difference between the limit
cycle and the stable focus than in the other cases.
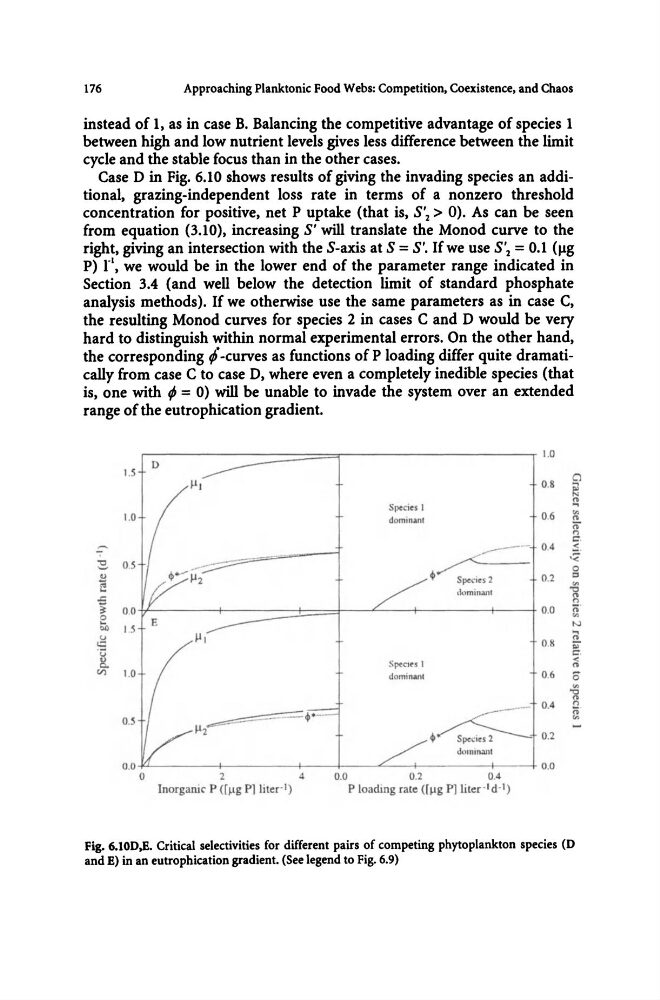
Case 0 in Fig. 6.10 shows results of giving the invading species an additional, grazing-independent loss rate in terms of a nonzero threshold
concentration for positive, net P uptake (that is, S'2> 0). As can be seen
from equation (3.10), increasing S' will translate the Monod curve to the
right, giving an intersection with the S-axis at S = S'. Ifwe use S'2 = 0.1 (~g
P) rl, we would be in the lower end of the parameter range indicated in
Section 3.4 (and well below the detection limit of standard phosphate
analysis methods). If we otherwise use the same parameters as in case C,
the resulting Monod curves for species 2 in cases C and 0 would be very
hard to distinguish within normal experimental errors. On the other hand,
the corresponding t/-curves as functions of P loading differ quite dramatically from case C to case 0, where even a completely inedible species (that
is, one with t/J = 0) will be unable to invade the system over an extended
range of the eutrophication gradient.
1.0
D
1.5
C'l
~l
0.8
....
~
"
Species 1
....
0.6
'"
1.0
dominan1
n
if c::.
~
--0.4
!:.
..... - -<
::::. 0.5
~
0
.,
+ Spe<;c,2
0.2
=
~
'"
lldminar'lt
~
-=
g
~
0.0
0.0
(> .
0
.,
;0 15
N
....
'-'
~I
0.8
"
<::
i»
v
c::.
8SpeCies I
<
"
Ci1
1.0
dominanl
0.6
0
'"
"0
"
0.4
n
----(>.
0.5
+~
'"
~1
0.2
OOmm.3nl
0.0
2
4
0.0
0.2
0.4
Inorganic P ([J.lg Plliter· l )
P loading rate
and E) in an eutrophication gradient. (See legend to Fig. 6.9)
Approaching Planktonic Food Webs: Competition, Coexistence, and Chaos
instead of 1, as in case B. Balancing the competitive advantage of species 1
between high and low nutrient levels gives less difference between the limit
cycle and the stable focus than in the other cases.
Case 0 in Fig. 6.10 shows results of giving the invading species an additional, grazing-independent loss rate in terms of a nonzero threshold
concentration for positive, net P uptake (that is, S'2> 0). As can be seen
from equation (3.10), increasing S' will translate the Monod curve to the
right, giving an intersection with the S-axis at S = S'. Ifwe use S'2 = 0.1 (~g
P) rl, we would be in the lower end of the parameter range indicated in
Section 3.4 (and well below the detection limit of standard phosphate
analysis methods). If we otherwise use the same parameters as in case C,
the resulting Monod curves for species 2 in cases C and 0 would be very
hard to distinguish within normal experimental errors. On the other hand,
the corresponding t/-curves as functions of P loading differ quite dramatically from case C to case 0, where even a completely inedible species (that
is, one with t/J = 0) will be unable to invade the system over an extended
range of the eutrophication gradient.
1.0
D
1.5
C'l
~l
0.8
....
~
"
Species 1
....
0.6
'"
1.0
dominan1
n
if c::.
~
--0.4
!:.
..... - -<
::::. 0.5
~
0
.,
+ Spe<;c,2
0.2
=
~
'"
lldminar'lt
~
-=
g
~
0.0
0.0
(> .
0
.,
;0 15
N
....
'-'
~I
0.8
"
<::
i»
v
c::.
8SpeCies I
<
"
Ci1
1.0
dominanl
0.6
0
'"
"0
"
0.4
n
----(>.
0.5
+~
'"
~1
0.2
OOmm.3nl
0.0
2
4
0.0
0.2
0.4
Inorganic P ([J.lg Plliter· l )
P loading rate
and E) in an eutrophication gradient. (See legend to Fig. 6.9)