

Eutrophication as an r-KSelection Gradient
163
1.0
Dissolved inorganic
til
2
0.8 plankton
0
..c p.
til
0.6
0
Zooplankton
..c p.
- t';S
....
S 0.4
~
0
= 0
....
0.2
.... u
t';S
d::
0.0
0
0.2
0.4
0.6
Phosphorus loading rate L p ([J-lg P] liter -I d -I)
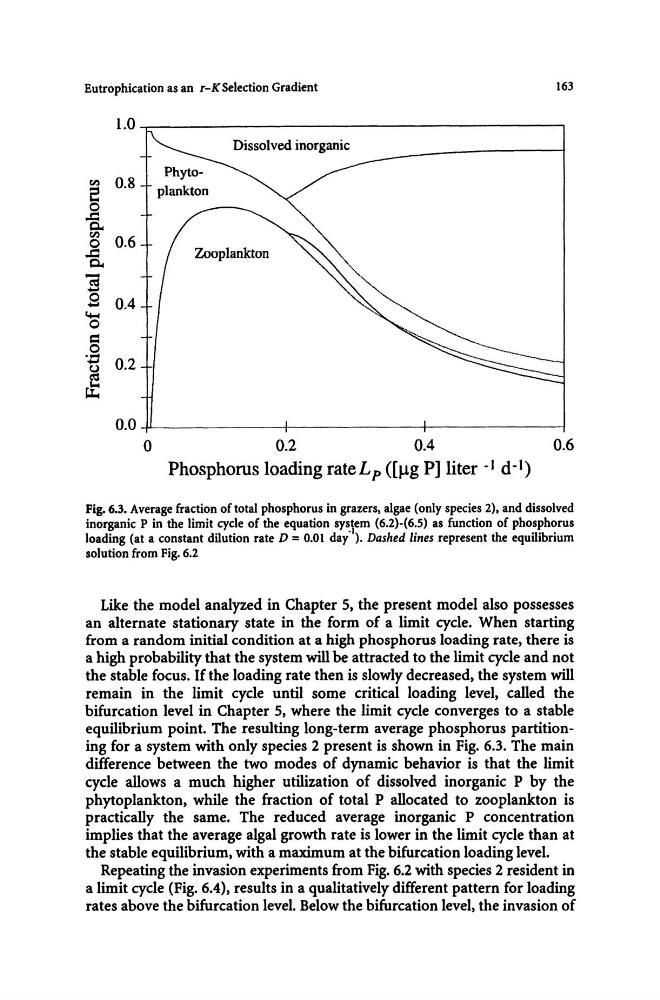
Fig. 6.3. Average fraction of total phosphorus in grazers, algae (only species 2), and dissolved
inorganic P in the limit cycle of the equation system (6.2}-(6.5) as function of phosphorus
loading (at a constant dilution rate D = 0.01 day-I). Dashed lines represent the equilibrium
solution from Fig. 6.2
Like the model analyzed in Chapter 5, the present model also possesses
an alternate stationary state in the form of a limit cycle. When starting
from a random initial condition at a high phosphorus loading rate, there is
a high probability that the system will be attracted to the limit cycle and not
the stable focus. If the loading rate then is slowly decreased, the system will
remain in the limit cycle until some critical loading level, called the
bifurcation level in Chapter 5, where the limit cycle converges to a stable
equilibrium point. The resulting long-term average phosphorus partitioning for a system with only species 2 present is shown in Fig. 6.3. The main
difference between the two modes of dynamic behavior is that the limit
cycle allows a much higher utilization of dissolved inorganic P by the
phytoplankton, while the fraction of total p allocated to zooplankton is
practically the same. The reduced average inorganic P concentration
implies that the average algal growth rate is lower in the limit cycle than at
the stable equilibrium, with a maximum at the bifurcation loading level.
Repeating the invasion experiments from Fig. 6.2 with species 2 resident in
a limit cycle (Fig. 6.4), results in a qualitatively different pattern for loading
rates above the bifurcation level. Below the bifurcation level, the invasion of
163
1.0
Dissolved inorganic
til
2
0.8 plankton
0
..c p.
til
0.6
0
Zooplankton
..c p.
- t';S
....
S 0.4
~
0
= 0
....
0.2
.... u
t';S
d::
0.0
0
0.2
0.4
0.6
Phosphorus loading rate L p ([J-lg P] liter -I d -I)
Fig. 6.3. Average fraction of total phosphorus in grazers, algae (only species 2), and dissolved
inorganic P in the limit cycle of the equation system (6.2}-(6.5) as function of phosphorus
loading (at a constant dilution rate D = 0.01 day-I). Dashed lines represent the equilibrium
solution from Fig. 6.2
Like the model analyzed in Chapter 5, the present model also possesses
an alternate stationary state in the form of a limit cycle. When starting
from a random initial condition at a high phosphorus loading rate, there is
a high probability that the system will be attracted to the limit cycle and not
the stable focus. If the loading rate then is slowly decreased, the system will
remain in the limit cycle until some critical loading level, called the
bifurcation level in Chapter 5, where the limit cycle converges to a stable
equilibrium point. The resulting long-term average phosphorus partitioning for a system with only species 2 present is shown in Fig. 6.3. The main
difference between the two modes of dynamic behavior is that the limit
cycle allows a much higher utilization of dissolved inorganic P by the
phytoplankton, while the fraction of total p allocated to zooplankton is
practically the same. The reduced average inorganic P concentration
implies that the average algal growth rate is lower in the limit cycle than at
the stable equilibrium, with a maximum at the bifurcation loading level.
Repeating the invasion experiments from Fig. 6.2 with species 2 resident in
a limit cycle (Fig. 6.4), results in a qualitatively different pattern for loading
rates above the bifurcation level. Below the bifurcation level, the invasion of