

162
Approaching Planktonic Food Webs: Competition, Coexistence, and Chaos
1.0~ ______________________________________ ~
Dissolved
0.8
1
inorganic
rn
2
phosphorus
]
c..
rn 0.6
0
..c:
c..
Phosphorus in
- ~ zooplankton
.....
B 0.4
c.o...
0
d
0
... 0.2
.....
u
e
~
0.0
0
0.2
0.4
0.6
Phosphorus loading rate ([J.1g P] liter -I d- 1 )
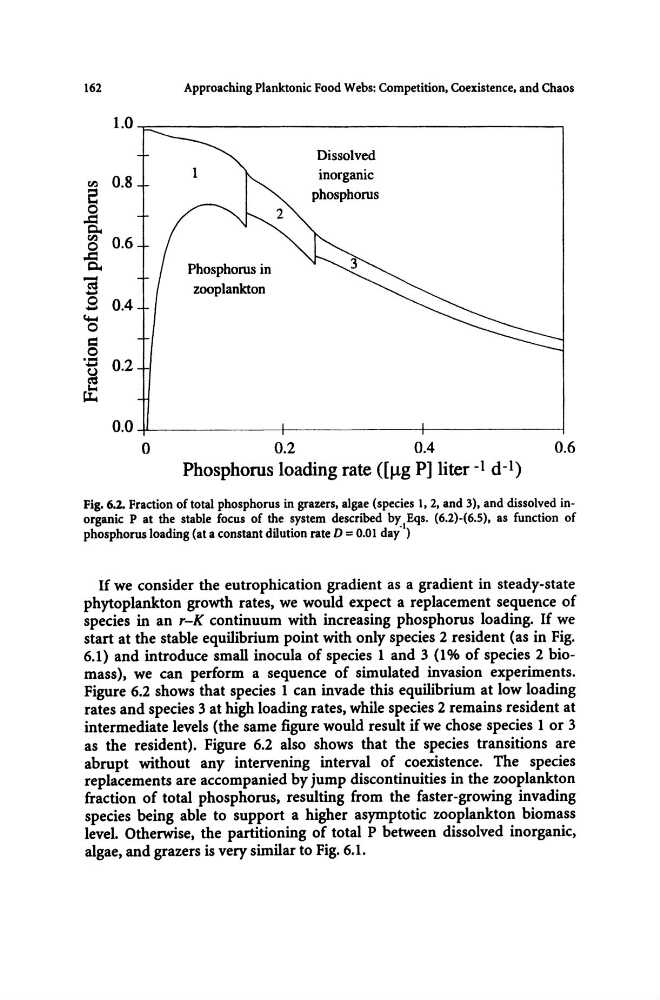
Fig. 6.2. Fraction of total phosphorus in grazers, algae (species 1,2, and 3), and dissolved inorganic P at the stable focus of the system described by Eqs. (6.2)-(6.5), as function of
phosphorus loading (at a constant dilution rate D = 0.01 day-I)
If we consider the eutrophication gradient as a gradient in steady-state
phytoplankton growth rates, we would expect a replacement sequence of
species in an r-K continuum with increasing phosphorus loading. If we
start at the stable equilibrium point with only species 2 resident (as in Fig.
6.1) and introduce small inocula of species 1 and 3 (1% of species 2 biomass), we can perform a sequence of simulated invasion experiments.
Figure 6.2 shows that species 1 can invade this equilibrium at low loading
rates and species 3 at high loading rates, while species 2 remains resident at
intermediate levels (the same figure would result if we chose species 1 or 3
as the resident). Figure 6.2 also shows that the species transitions are
abrupt without any intervening interval of coexistence. The species
replacements are accompanied by jump discontinuities in the zooplankton
fraction of total phosphorus, resulting from the faster-growing invading
species being able to support a higher asymptotic zooplankton biomass
level. Otherwise, the partitioning of total P between dissolved inorganic,
algae, and grazers is very similar to Fig. 6.1.
Approaching Planktonic Food Webs: Competition, Coexistence, and Chaos
1.0~ ______________________________________ ~
Dissolved
0.8
1
inorganic
rn
2
phosphorus
]
c..
rn 0.6
0
..c:
c..
Phosphorus in
- ~ zooplankton
.....
B 0.4
c.o...
0
d
0
... 0.2
.....
u
e
~
0.0
0
0.2
0.4
0.6
Phosphorus loading rate ([J.1g P] liter -I d- 1 )
Fig. 6.2. Fraction of total phosphorus in grazers, algae (species 1,2, and 3), and dissolved inorganic P at the stable focus of the system described by Eqs. (6.2)-(6.5), as function of
phosphorus loading (at a constant dilution rate D = 0.01 day-I)
If we consider the eutrophication gradient as a gradient in steady-state
phytoplankton growth rates, we would expect a replacement sequence of
species in an r-K continuum with increasing phosphorus loading. If we
start at the stable equilibrium point with only species 2 resident (as in Fig.
6.1) and introduce small inocula of species 1 and 3 (1% of species 2 biomass), we can perform a sequence of simulated invasion experiments.
Figure 6.2 shows that species 1 can invade this equilibrium at low loading
rates and species 3 at high loading rates, while species 2 remains resident at
intermediate levels (the same figure would result if we chose species 1 or 3
as the resident). Figure 6.2 also shows that the species transitions are
abrupt without any intervening interval of coexistence. The species
replacements are accompanied by jump discontinuities in the zooplankton
fraction of total phosphorus, resulting from the faster-growing invading
species being able to support a higher asymptotic zooplankton biomass
level. Otherwise, the partitioning of total P between dissolved inorganic,
algae, and grazers is very similar to Fig. 6.1.