

6.2. CORAL RECORDS
. Spring
Autumn
167
(a)
(b)
(c)
(d)
faster in summer than in winter. Changes in the diameter of the spine are
caused by variations through the year in the amount of thickening; that is, they
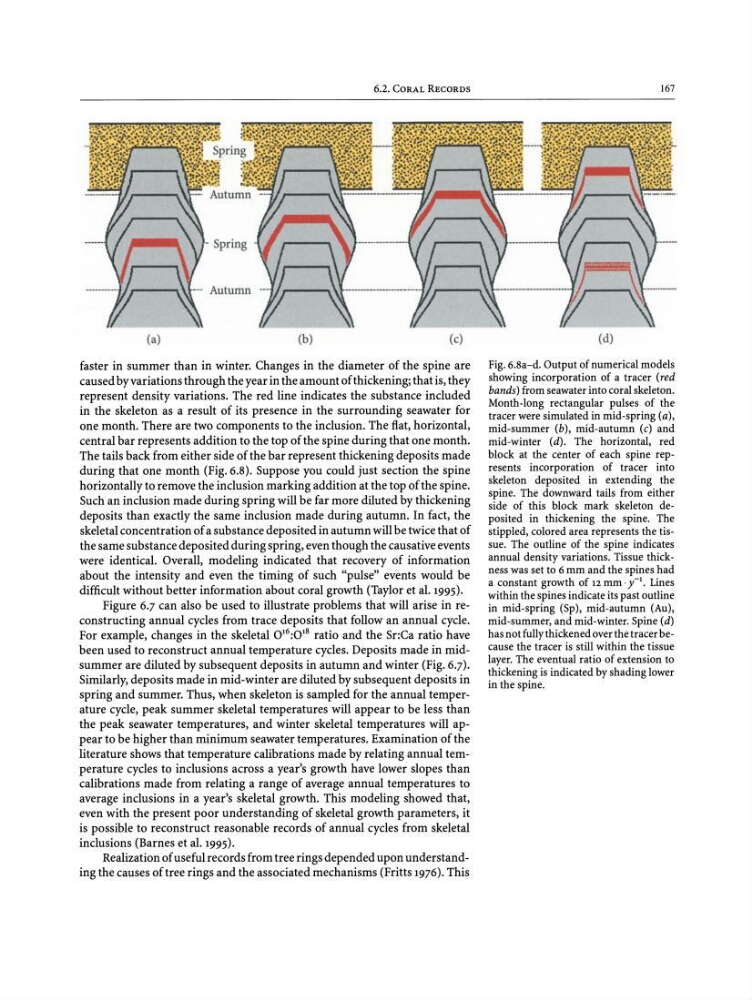
represent density variations. The red line indicates the substance included
in the skeleton as a result of its presence in the surrounding seawater for
one month. There are two components to the inclusion. The flat, horizontal,
central bar represents addition to the top of the spine during that one month.
The tails back from either side of the bar represent thickening deposits made
during that one month (Fig. 6.8). Suppose you could just section the spine
horizontally to remove the inclusion marking addition at the top of the spine .
Such an inclusion made during spring will be far more diluted by thickening
deposits than exactly the same inclusion made during autumn. In fact, the
skeletal concentration of a substance deposited in autumn will be twice that of
the same substance deposited during spring, even though the causative events
were identical. Overall, modeling indicated that recovery of information
about the intensity and even the timing of such "pulse" events would be
difficult without better information about coral growth (Taylor et al. 1995).
Figure 6.7 can also be used to illustrate problems that will arise in reconstructing annual cycles from trace deposits that follow an annual cycle.
For example, changes in the skeletal 0
16:018 ratio and the Sr:Ca ratio have
been used to reconstruct annual temperature cycles. Deposits made in midsummer are diluted by subsequent deposits in autumn and winter (Fig. 6.7) .
Similarly, deposits made in mid-winter are diluted by subsequent deposits in
spring and summer. Thus, when skeleton is sampled for the annual temperature cycle, peak summer skeletal temperatures will appear to be less than
the peak seawater temperatures, and winter skeletal temperatures will appear to be higher than minimum seawater temperatures. Examination of the
literature shows that temperature calibrations made by relating annual temperature cycles to inclusions across a year's growth have lower slopes than
calibrations made from relating a range of average annual temperatures to
average inclusions in a year 's skeletal growth. This modeling showed that,
even with the present poor understanding of skeletal growth parameters, it
is possible to reconstruct reasonable records of annual cycles from skeletal
inclusions (Barnes et al. 1995).
Realization of useful records from tree rings depended upon understanding the causes of tree rings and the associated mechanisms (Fritts 1976). This
Fig. 6.8a-d. Output of numericalmodels
showing incorporation of a tracer (red
bands) fromseawater into coralskeleton.
Month-long rectangular pulses of the
tracer weresimulatedin mid-spring(a),
mid-summer (b), mid-autumn (c) and
mid-winter (d) . The horizontal, red
block at the center of each spine represents incorporation of tracer into
skeleton deposited in extending the
spine. The downward tails from either
side of this block mark skeleton deposited in thickening the spine. The
stippled,coloredarea represents the tissue. The outline of the spine indicates
annual density variations. Tissue thickness wasset to 6 mm and the spines had
a constant growth of 12 mm .y-1. Lines
withinthe spinesindicateits past outline
in mid-spring (Sp), mid-autumn (Au),
mid-summer, and mid-winter. Spine (d)
hasnot fullythickenedoverthetracerbecause the tracer is still within the tissue
layer. The eventual ratio of extension to
thickening is indicatedbyshadinglower
in the spine.
. Spring
Autumn
167
(a)
(b)
(c)
(d)
faster in summer than in winter. Changes in the diameter of the spine are
caused by variations through the year in the amount of thickening; that is, they
represent density variations. The red line indicates the substance included
in the skeleton as a result of its presence in the surrounding seawater for
one month. There are two components to the inclusion. The flat, horizontal,
central bar represents addition to the top of the spine during that one month.
The tails back from either side of the bar represent thickening deposits made
during that one month (Fig. 6.8). Suppose you could just section the spine
horizontally to remove the inclusion marking addition at the top of the spine .
Such an inclusion made during spring will be far more diluted by thickening
deposits than exactly the same inclusion made during autumn. In fact, the
skeletal concentration of a substance deposited in autumn will be twice that of
the same substance deposited during spring, even though the causative events
were identical. Overall, modeling indicated that recovery of information
about the intensity and even the timing of such "pulse" events would be
difficult without better information about coral growth (Taylor et al. 1995).
Figure 6.7 can also be used to illustrate problems that will arise in reconstructing annual cycles from trace deposits that follow an annual cycle.
For example, changes in the skeletal 0
16:018 ratio and the Sr:Ca ratio have
been used to reconstruct annual temperature cycles. Deposits made in midsummer are diluted by subsequent deposits in autumn and winter (Fig. 6.7) .
Similarly, deposits made in mid-winter are diluted by subsequent deposits in
spring and summer. Thus, when skeleton is sampled for the annual temperature cycle, peak summer skeletal temperatures will appear to be less than
the peak seawater temperatures, and winter skeletal temperatures will appear to be higher than minimum seawater temperatures. Examination of the
literature shows that temperature calibrations made by relating annual temperature cycles to inclusions across a year's growth have lower slopes than
calibrations made from relating a range of average annual temperatures to
average inclusions in a year 's skeletal growth. This modeling showed that,
even with the present poor understanding of skeletal growth parameters, it
is possible to reconstruct reasonable records of annual cycles from skeletal
inclusions (Barnes et al. 1995).
Realization of useful records from tree rings depended upon understanding the causes of tree rings and the associated mechanisms (Fritts 1976). This
Fig. 6.8a-d. Output of numericalmodels
showing incorporation of a tracer (red
bands) fromseawater into coralskeleton.
Month-long rectangular pulses of the
tracer weresimulatedin mid-spring(a),
mid-summer (b), mid-autumn (c) and
mid-winter (d) . The horizontal, red
block at the center of each spine represents incorporation of tracer into
skeleton deposited in extending the
spine. The downward tails from either
side of this block mark skeleton deposited in thickening the spine. The
stippled,coloredarea represents the tissue. The outline of the spine indicates
annual density variations. Tissue thickness wasset to 6 mm and the spines had
a constant growth of 12 mm .y-1. Lines
withinthe spinesindicateits past outline
in mid-spring (Sp), mid-autumn (Au),
mid-summer, and mid-winter. Spine (d)
hasnot fullythickenedoverthetracerbecause the tracer is still within the tissue
layer. The eventual ratio of extension to
thickening is indicatedbyshadinglower
in the spine.