

166
6. ApPLICATIONS
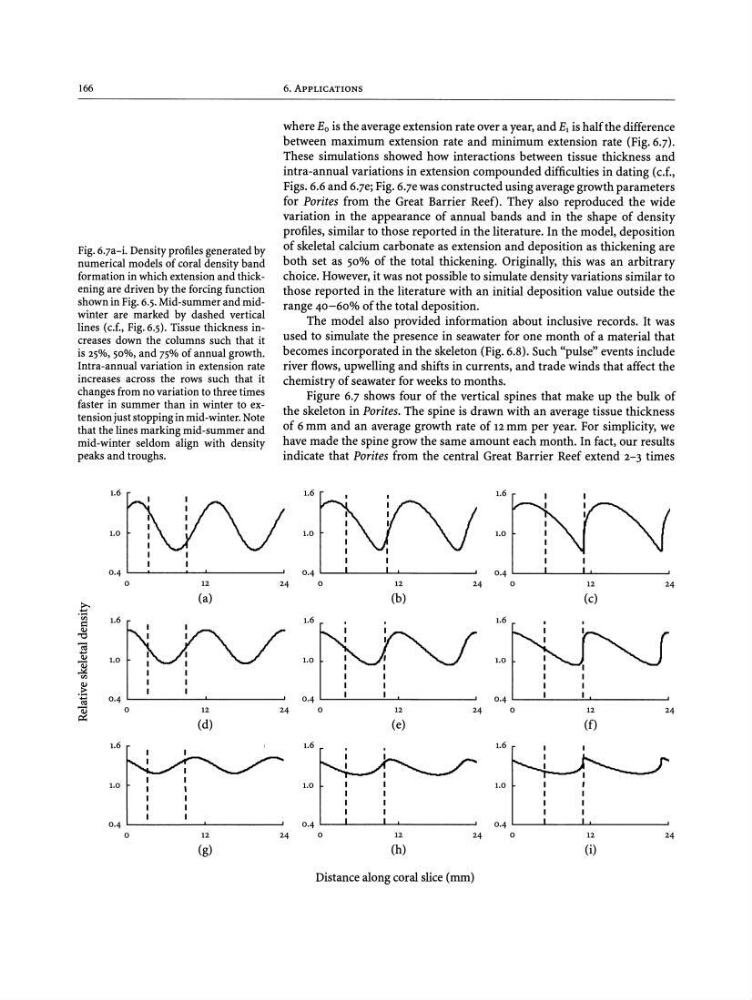
Fig. 6.7a-i. Density profiles generated by
numerical models of coral density band
formation in which extension and thickening are driven by the forcing function
shown in Fig. 6.5.Mid-summer and midwinter are marked by dashed vertical
lines (c.f., Fig. 6.5). Tissue thickness increases down the columns such that it
is 25%, 50%, and 75%of annual growth.
Intra-annual variation in extension rate
increases across the rows such that it
changes from no variation to three times
faster in summer than in winter to extension just stopping in mid-winter. Note
that the lines marking mid -summer and
mid-winter seldom align with density
peaks and troughs.
where Eo is the average extension rate over a year, and E, is half the difference
between maximum extension rate and minimum extension rate (Fig. 6.7).
These simulations showed how interactions between tissue thickness and
intra-annual variations in extension compounded difficulties in dating (c.f.,
Figs. 6.6 and 6.7e;Fig. 6.7ewas constructed using average growth parameters
for Porites from the Great Barrier Reef). They also reproduced the wide
variation in the appearance of annual bands and in the shape of density
profiles, similar to those reported in the literature. In the model, deposition
of skeletal calcium carbonate as extension and deposition as thickening are
both set as 50% of the total thickening. Originally, this was an arbitrary
choice. However, it was not possible to simulate density variations similar to
those reported in the literature with an initial deposition value outside the
range 40-60% of the total deposition.
The model also provided information about inclusive records. It was
used to simulate the presence in seawater for one month of a material that
becomes incorporated in the skeleton (Fig. 6.8). Such "pulse" events include
river flows, upwelling and shifts in currents, and trade winds that affect the
chemistry of seawater for weeks to months.
Figure 6.7 shows four of the vertical spines that make up the bulk of
the skeleton in Porites. The spine is drawn with an average tissue thickness
of 6 mm and an average growth rate of 12 mm per year. For simplicity, we
have made the spine grow the same amount each month. In fact, our results
indicate that Porites from the central Great Barrier Reef extend 2-3 times
24
24
24
12
12
12
(f)
(c)
1.6
1.0
0 ·4
24
0
1.6
1.0
0·4
24
0
1.6
1.0
0 ·4
24
0
12
12
12
(e)
(b)
1.6
1.0
0 ·4
24
0
1.6
1.0
0 ·4
24
0
1.6
1.0
0 ·4
24
0
12
12
12
(a)
(d)
1.6
1.0
0 ·4
0
e-,
....
' CiJ
1.6
!=1
Q)
"0
Q)
1.0
]
ell
~
.:g 0 ·4
Q)
0
p:;
1.6
1.0
0 ·4
0
(g)
(h)
(i)
Distance along coral slice (mm)
6. ApPLICATIONS
Fig. 6.7a-i. Density profiles generated by
numerical models of coral density band
formation in which extension and thickening are driven by the forcing function
shown in Fig. 6.5.Mid-summer and midwinter are marked by dashed vertical
lines (c.f., Fig. 6.5). Tissue thickness increases down the columns such that it
is 25%, 50%, and 75%of annual growth.
Intra-annual variation in extension rate
increases across the rows such that it
changes from no variation to three times
faster in summer than in winter to extension just stopping in mid-winter. Note
that the lines marking mid -summer and
mid-winter seldom align with density
peaks and troughs.
where Eo is the average extension rate over a year, and E, is half the difference
between maximum extension rate and minimum extension rate (Fig. 6.7).
These simulations showed how interactions between tissue thickness and
intra-annual variations in extension compounded difficulties in dating (c.f.,
Figs. 6.6 and 6.7e;Fig. 6.7ewas constructed using average growth parameters
for Porites from the Great Barrier Reef). They also reproduced the wide
variation in the appearance of annual bands and in the shape of density
profiles, similar to those reported in the literature. In the model, deposition
of skeletal calcium carbonate as extension and deposition as thickening are
both set as 50% of the total thickening. Originally, this was an arbitrary
choice. However, it was not possible to simulate density variations similar to
those reported in the literature with an initial deposition value outside the
range 40-60% of the total deposition.
The model also provided information about inclusive records. It was
used to simulate the presence in seawater for one month of a material that
becomes incorporated in the skeleton (Fig. 6.8). Such "pulse" events include
river flows, upwelling and shifts in currents, and trade winds that affect the
chemistry of seawater for weeks to months.
Figure 6.7 shows four of the vertical spines that make up the bulk of
the skeleton in Porites. The spine is drawn with an average tissue thickness
of 6 mm and an average growth rate of 12 mm per year. For simplicity, we
have made the spine grow the same amount each month. In fact, our results
indicate that Porites from the central Great Barrier Reef extend 2-3 times
24
24
24
12
12
12
(f)
(c)
1.6
1.0
0 ·4
24
0
1.6
1.0
0·4
24
0
1.6
1.0
0 ·4
24
0
12
12
12
(e)
(b)
1.6
1.0
0 ·4
24
0
1.6
1.0
0 ·4
24
0
1.6
1.0
0 ·4
24
0
12
12
12
(a)
(d)
1.6
1.0
0 ·4
0
e-,
....
' CiJ
1.6
!=1
Q)
"0
Q)
1.0
]
ell
~
.:g 0 ·4
Q)
0
p:;
1.6
1.0
0 ·4
0
(g)
(h)
(i)
Distance along coral slice (mm)