

6.2. CORAL RECORDS
165
Time = t
t + 15 days
1+ 30 days
(a)
(b)
(c)
thickening through the depth of the tissue layer, this anticipation could
vary between < 1 and> 8 months (Barnes and Lough 1992a). Consequently,
failure to link density and environmental variations by correlations is not
surprising.
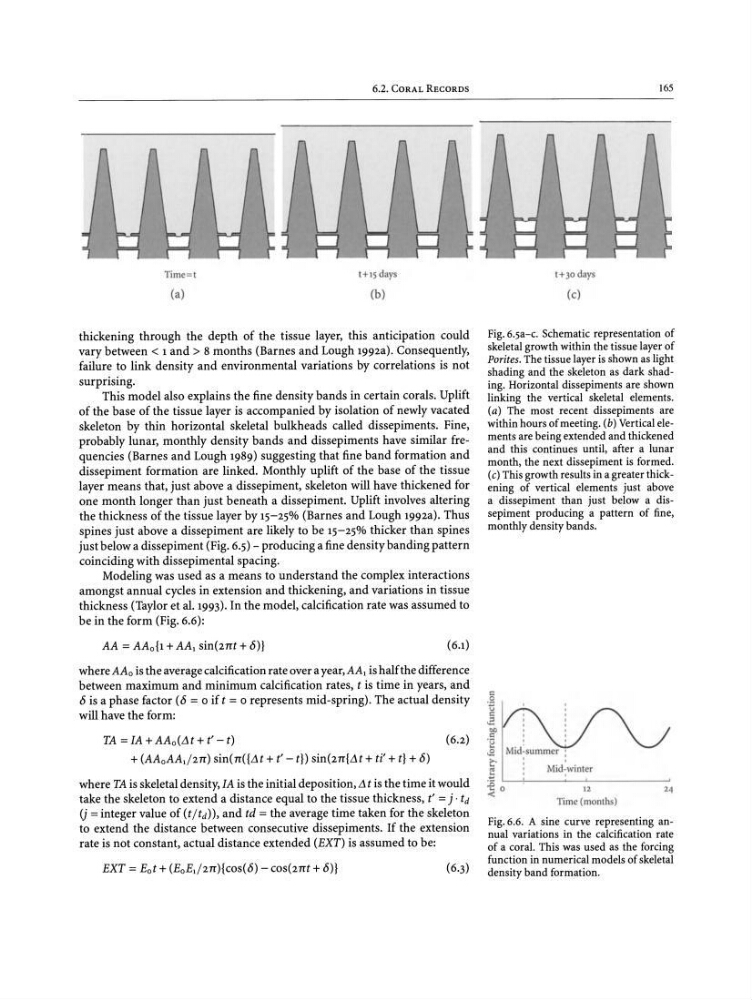
This model also explains the fine density bands in certain corals. Uplift
of the base of the tissue layer is accompanied by isolation of newly vacated
skeleton by thin horizontal skeletal bulkheads called dissepiments. Fine,
probably lunar, monthly density bands and dissepiments have similar frequencies (Barnes and Lough 1989) suggesting that fine band formation and
dissepiment formation are linked. Monthly uplift of the base of the tissue
layer means that, just above a dissepiment, skeleton will have thickened for
one month longer than just beneath a dissepiment. Uplift involves altering
the thickness of the tissue layer by 15-25% (Barnes and Lough 1992a). Thus
spines just above a dissepiment are likely to be 15-25% thicker than spines
just below a dissepiment (Fig. 6.5) - producing a fine density banding pattern
coinciding with dissepimental spacing.
Modeling was used as a means to understand the complex interactions
amongst annual cycles in extension and thickening, and variations in tissue
thickness (Taylor et al. 1993). In the model, calcification rate was assumed to
be in the form (Fig. 6.6):
Fig.e.sa-c. Schematic representation of
skeletalgrowth within the tissue layerof
Porites. The tissue layeris shown as light
shading and the skeleton as dark shading. Horizontal dissepiments are shown
linking the vertical skeletal elements.
(a) The most recent dissepiments are
within hours of meeting.(b) Vertical elements are being extended and thickened
and this continues until, after a lunar
month, the next dissepiment is formed.
(c) Thisgrowth results in a greater thickening of vertical elements just above
a dissepiment than just below a dissepiment producing a pattern of fine,
monthly density bands.
AA = AAo{l+ AA 1 sintz rrr + 8)}
(6.1)
TA =fA+AA o(.1t+t'-t)
(6.2)
+ (AA oAA I / 2rr ) sin( rr({M + t' - t}) sin(2rr{M + ti' + t} + 8)
where AA o is the average calcification rate over a year, AA 1 is halfthe difference
between maximum and minimum calcification rates, t is time in years, and
8 is a phase factor (8 = 0 if t = 0 represents mid-spring). The actual density
will have the form:
where TA is skeletal density, fA is the initial deposition, L1 t is the time it would
take the skeleton to extend a distance equal to the tissue thickness, t' = j . td
(j = integer value of (t ltd», and td = the average time taken for the skeleton
to extend the distance between consecutive dissepiments. If the extension
rate is not constant, actual distance extended (EXT) is assumed to be:
24
Mid:summer :
,
Mid -winter
12
Time (months)
Fig.6.6. A sine curve representing annual variations in the calcification rate
of a coral. This was used as the forcing
function in numerical models of skeletal
density band formation.
r::
.9
v r::
2
OQ
r::
"2
.£
C
.;
:e o '-----'---~-....L-------'
-e
(6·3)
EXT = Eot + (EoE./m){cos(8) - costzrrr + 8)}
165
Time = t
t + 15 days
1+ 30 days
(a)
(b)
(c)
thickening through the depth of the tissue layer, this anticipation could
vary between < 1 and> 8 months (Barnes and Lough 1992a). Consequently,
failure to link density and environmental variations by correlations is not
surprising.
This model also explains the fine density bands in certain corals. Uplift
of the base of the tissue layer is accompanied by isolation of newly vacated
skeleton by thin horizontal skeletal bulkheads called dissepiments. Fine,
probably lunar, monthly density bands and dissepiments have similar frequencies (Barnes and Lough 1989) suggesting that fine band formation and
dissepiment formation are linked. Monthly uplift of the base of the tissue
layer means that, just above a dissepiment, skeleton will have thickened for
one month longer than just beneath a dissepiment. Uplift involves altering
the thickness of the tissue layer by 15-25% (Barnes and Lough 1992a). Thus
spines just above a dissepiment are likely to be 15-25% thicker than spines
just below a dissepiment (Fig. 6.5) - producing a fine density banding pattern
coinciding with dissepimental spacing.
Modeling was used as a means to understand the complex interactions
amongst annual cycles in extension and thickening, and variations in tissue
thickness (Taylor et al. 1993). In the model, calcification rate was assumed to
be in the form (Fig. 6.6):
Fig.e.sa-c. Schematic representation of
skeletalgrowth within the tissue layerof
Porites. The tissue layeris shown as light
shading and the skeleton as dark shading. Horizontal dissepiments are shown
linking the vertical skeletal elements.
(a) The most recent dissepiments are
within hours of meeting.(b) Vertical elements are being extended and thickened
and this continues until, after a lunar
month, the next dissepiment is formed.
(c) Thisgrowth results in a greater thickening of vertical elements just above
a dissepiment than just below a dissepiment producing a pattern of fine,
monthly density bands.
AA = AAo{l+ AA 1 sintz rrr + 8)}
(6.1)
TA =fA+AA o(.1t+t'-t)
(6.2)
+ (AA oAA I / 2rr ) sin( rr({M + t' - t}) sin(2rr{M + ti' + t} + 8)
where AA o is the average calcification rate over a year, AA 1 is halfthe difference
between maximum and minimum calcification rates, t is time in years, and
8 is a phase factor (8 = 0 if t = 0 represents mid-spring). The actual density
will have the form:
where TA is skeletal density, fA is the initial deposition, L1 t is the time it would
take the skeleton to extend a distance equal to the tissue thickness, t' = j . td
(j = integer value of (t ltd», and td = the average time taken for the skeleton
to extend the distance between consecutive dissepiments. If the extension
rate is not constant, actual distance extended (EXT) is assumed to be:
24
Mid:summer :
,
Mid -winter
12
Time (months)
Fig.6.6. A sine curve representing annual variations in the calcification rate
of a coral. This was used as the forcing
function in numerical models of skeletal
density band formation.
r::
.9
v r::
2
OQ
r::
"2
.£
C
.;
:e o '-----'---~-....L-------'
-e
(6·3)
EXT = Eot + (EoE./m){cos(8) - costzrrr + 8)}