

5.2. TRAN SPLANTATION AND OTHER PERTURBATION E XPERIMENTS
153
(a)
(b)
~)
(~
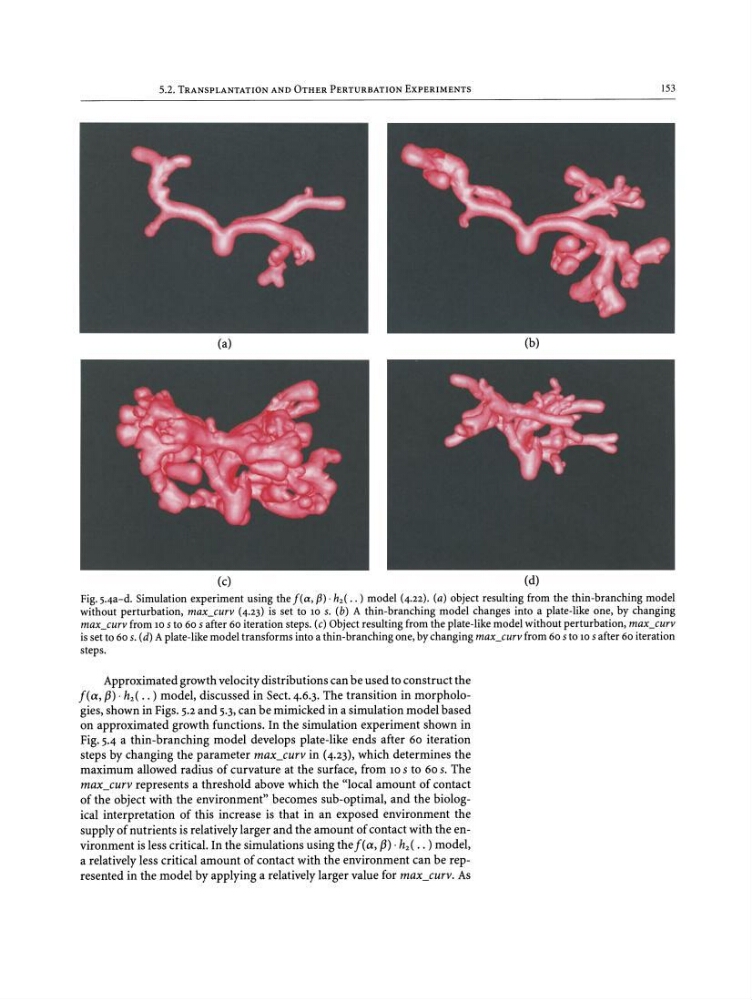
Fig.s.aa-d. Simulation experiment using the [ta, f3) . h 2 ( •• ) model (4 .22). (a) object resulting from the thin -branching model
without perturbation, max_curv (4.23) is set to 10 s. (b) A thin-bran ching model changes into a plate-like one, by changing
max_curv from 10 5 to 60 5 after 60 iteration steps. (c) Object resulting from the plate-like model without perturbation, max_curv
is set to 60 s. (d) A plate-like model transforms into a thin-branching one, by changing max_curv from 60 5 to 10 5 after 60 iteration
steps.
Approximated growth velocity distributions can be used to construct the
[t « , (3) . h 2 ( •• ) model, discussed in Sect. 4.6.3. The transition in morphologies , shown in Figs. 5.2 and 5.3, can be mimicked in a simulation model based
on approximated growth functions. In the simulation experiment shown in
Fig. 5.4 a thin-branching model develops plate-like ends after 60 iteration
steps by changing the par ameter max_curv in (4.23), which determines the
maximum allowed radius of curvature at the surface, from 10 5 to 60 s. The
max_curv represents a threshold above which the "local am ount of contact
of the ob ject with the environment" becomes sub-optimal, and the biological interpretation of this increase is that in an exposed environment the
supply of nutrients is relatively larger and the amount of contact with the environment is less critical. In the simulations using the f( a, (3) . h«( .. ) model,
a relatively less critical am ount of contact with the environment can be represented in the model by applying a relatively larger value for max_curv. As
153
(a)
(b)
~)
(~
Fig.s.aa-d. Simulation experiment using the [ta, f3) . h 2 ( •• ) model (4 .22). (a) object resulting from the thin -branching model
without perturbation, max_curv (4.23) is set to 10 s. (b) A thin-bran ching model changes into a plate-like one, by changing
max_curv from 10 5 to 60 5 after 60 iteration steps. (c) Object resulting from the plate-like model without perturbation, max_curv
is set to 60 s. (d) A plate-like model transforms into a thin-branching one, by changing max_curv from 60 5 to 10 5 after 60 iteration
steps.
Approximated growth velocity distributions can be used to construct the
[t « , (3) . h 2 ( •• ) model, discussed in Sect. 4.6.3. The transition in morphologies , shown in Figs. 5.2 and 5.3, can be mimicked in a simulation model based
on approximated growth functions. In the simulation experiment shown in
Fig. 5.4 a thin-branching model develops plate-like ends after 60 iteration
steps by changing the par ameter max_curv in (4.23), which determines the
maximum allowed radius of curvature at the surface, from 10 5 to 60 s. The
max_curv represents a threshold above which the "local am ount of contact
of the ob ject with the environment" becomes sub-optimal, and the biological interpretation of this increase is that in an exposed environment the
supply of nutrients is relatively larger and the amount of contact with the environment is less critical. In the simulations using the f( a, (3) . h«( .. ) model,
a relatively less critical am ount of contact with the environment can be represented in the model by applying a relatively larger value for max_curv. As