

4.6. ACCRETIVE GROWTH
129
y-axis
x-axis
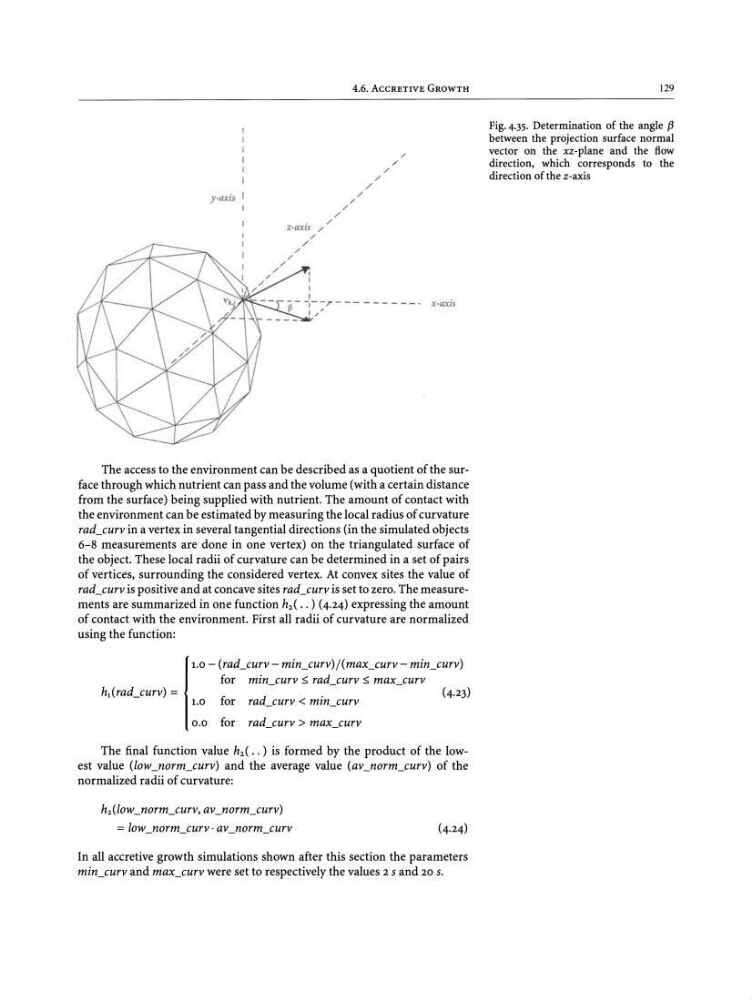
Fig. 4.35. Determination of the angle f3
between the projection surface normal
vector on the xz-plane and the flow
direction, which corresponds to the
direction ofthe z-axis
The access to the environment can be described as a quotient of the surface through which nutrient can pass and the volume (with a certain distance
from the surface) being supplied with nutrient. The amount of contact with
the environment can be estimated by measuring the local radius of curvature
rad_curv in a vertex in several tangential directions (in the simulated objects
6-8 measurements are done in one vertex) on the triangulated surface of
the object. These local radii of curvature can be determined in a set of pairs
of vertices, surrounding the considered vertex. At convex sites the value of
rad_curv is positive and at concave sites rad_curv is set to zero. The measurements are summarized in one function h 2 ( •• ) (4.24) expressing the amount
of contact with the environment. First all radii of curvature are normalized
using the function:
1
1. 0 - (rad_curv - min_curv) j(max_curv - min_curv)
for min curv:::; rad curv s: max curv
h 1(rad_curv) =
-
. -
-
(4.23)
1.0
for rad_curv < mm_curv
0.0
for rad_curv > max_curv
The final function value h 2 ( •• ) is formed by the product of the lowest value (low_norm_curv) and the average value (av_norm_curv) of the
normalized radii of curvature:
h 2(low _norm_curv, av_norm_curv)
= low_norm_curv· av_norm_curv
In all accretive growth simulations shown after this section the parameters
min_curv and max_curv were set to respectively the values 2 sand 20 S.
129
y-axis
x-axis
Fig. 4.35. Determination of the angle f3
between the projection surface normal
vector on the xz-plane and the flow
direction, which corresponds to the
direction ofthe z-axis
The access to the environment can be described as a quotient of the surface through which nutrient can pass and the volume (with a certain distance
from the surface) being supplied with nutrient. The amount of contact with
the environment can be estimated by measuring the local radius of curvature
rad_curv in a vertex in several tangential directions (in the simulated objects
6-8 measurements are done in one vertex) on the triangulated surface of
the object. These local radii of curvature can be determined in a set of pairs
of vertices, surrounding the considered vertex. At convex sites the value of
rad_curv is positive and at concave sites rad_curv is set to zero. The measurements are summarized in one function h 2 ( •• ) (4.24) expressing the amount
of contact with the environment. First all radii of curvature are normalized
using the function:
1
1. 0 - (rad_curv - min_curv) j(max_curv - min_curv)
for min curv:::; rad curv s: max curv
h 1(rad_curv) =
-
. -
-
(4.23)
1.0
for rad_curv < mm_curv
0.0
for rad_curv > max_curv
The final function value h 2 ( •• ) is formed by the product of the lowest value (low_norm_curv) and the average value (av_norm_curv) of the
normalized radii of curvature:
h 2(low _norm_curv, av_norm_curv)
= low_norm_curv· av_norm_curv
In all accretive growth simulations shown after this section the parameters
min_curv and max_curv were set to respectively the values 2 sand 20 S.