

134
4 Molecular Evolution
0.06 to 0.21 for the vertebrates, i.e. there is a twoto threefold higher proportion of heterozygous
loci [17].
Past investigations of protein polymorphism
have almost all been carried out using the same
three dozen enzymes which are easily stained and
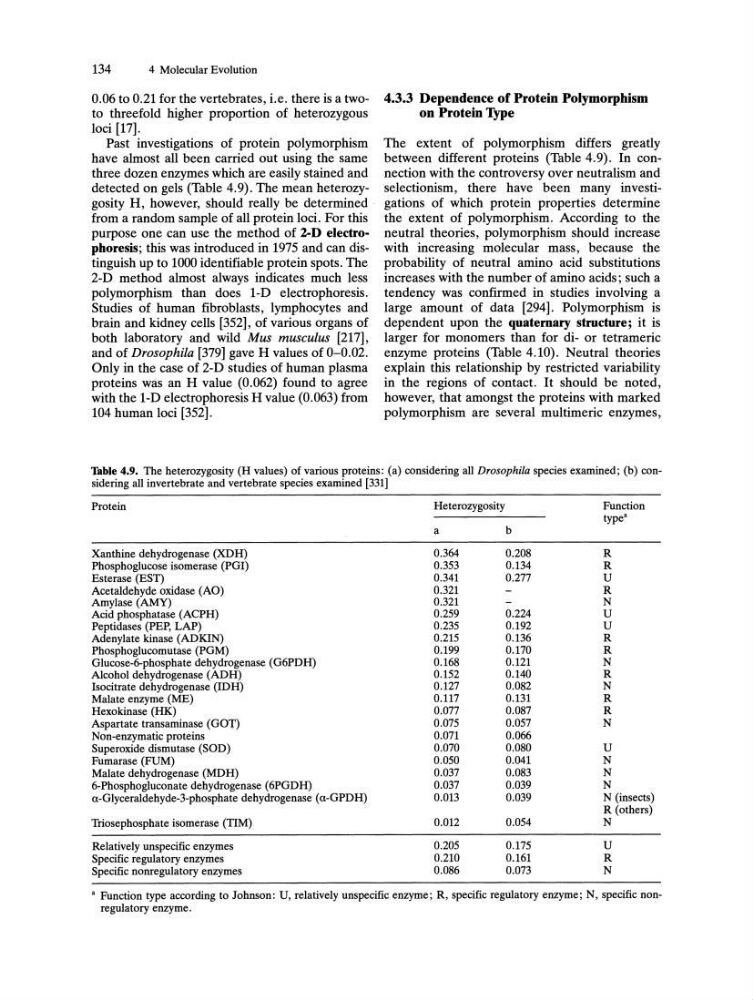
detected on gels (Table 4.9). The mean heterozygosity H, however, should really be determined .
from a random sample of all protein loci. For this
purpose one can use the method of 2-D electrophoresis; this was introduced in 1975 and can distinguish up to 1000 identifiable protein spots. The
2-D method almost always indicates much less
polymorphism than does 1-D electrophoresis.
Studies of human fibroblasts, lymphocytes and
brain and kidney cells [352], of various organs of
both laboratory and wild Mus musculus [217],
and of Drosophila [379] gave H values of 0-0.02.
Only in the case of 2-D studies of human plasma
proteins was an H value (0.062) found to agree
with the 1-D electrophoresis H value (0.063) from
104 human loci [352].
4.3.3 Dependence of Protein Polymorphism
on Protein 1YPe
The extent of polymorphism differs greatly
between different proteins (Table 4.9). In connection with the controversy over neutralism and
selectionism, there have been many investigations of which protein properties determine
the extent of polymorphism. According to the
neutral theories, polymorphism should increase
with increasing molecular mass, because the
probability of neutral amino acid substitutions
increases with the number of amino acids; such a
tendency was confirmed in studies involving a
large amount of data [294]. Polymorphism is
dependent upon the quaternary structure; it is
larger for monomers than for di- or tetrameric
enzyme proteins (Table 4.10). Neutral theories
explain this relationship by restricted variability
in the regions of contact. It should be noted,
however, that amongst the proteins with marked
polymorphism are several multimeric enzymes,
Table 4.9. The heterozygosity (H values) of various proteins: (a) considering all Drosophila species examined; (b) considering all invertebrate and vertebrate species examined [331]
Protein
Heterozygosity
Function
type"
a
b
Xanthine dehydrogenase (XDH)
0.364
0.208
R
Phosphoglucose isomerase (PGI)
0.353
0.134
R
Esterase (EST)
0.341
0.277
U
Acetaldehyde oxidase (AO)
0.321
R
Amylase (AMY)
0.321
N
Acid phosphatase (ACPH)
0.259
0.224
U
Peptidases (PEP, LAP)
0.235
0.192
U
Adenylate kinase (AD KIN)
0.215
0.136
R
Phosphoglucomutase (PGM)
0.199
0.170
R
Glucose-6-phosphate dehydrogenase (G6PDH)
0.168
0.121
N
Alcohol dehydrogenase (ADH)
0.152
0.140
R
lsocitrate dehydrogenase (IDH)
0.127
0.082
N
Malate enzyme (ME)
0.117
0.131
R
Hexokinase (HK)
0.077
0.087
R
Aspartate transaminase (GOT)
0.075
0.057
N
Non-enzymatic proteins
0.071
0.066
Superoxide dismutase (SOD)
0.070
0.080
U
Fumarase (FUM)
0.050
0.041
N
Malate dehydrogenase (MDH)
0.037
0.083
N
6-Phosphogluconate dehydrogenase (6PGDH)
0.037
0.039
N
a-Glyceraldehyde-3-phosphate dehydrogenase (a-GPDH)
0.013
0.039
N (insects)
R (others)
Triosephosphate isomerase (TIM)
0.012
0.054
N
Relatively unspecific enzymes
0.205
0.175
U
Specific regulatory enzymes
0.210
0.161
R
Specific nonregulatory enzymes
0.086
0.073
N
" Function type according to Johnson: U, relatively unspecific enzyme; R, specific regulatory enzyme; N, specific nonregulatory enzyme.
4 Molecular Evolution
0.06 to 0.21 for the vertebrates, i.e. there is a twoto threefold higher proportion of heterozygous
loci [17].
Past investigations of protein polymorphism
have almost all been carried out using the same
three dozen enzymes which are easily stained and
detected on gels (Table 4.9). The mean heterozygosity H, however, should really be determined .
from a random sample of all protein loci. For this
purpose one can use the method of 2-D electrophoresis; this was introduced in 1975 and can distinguish up to 1000 identifiable protein spots. The
2-D method almost always indicates much less
polymorphism than does 1-D electrophoresis.
Studies of human fibroblasts, lymphocytes and
brain and kidney cells [352], of various organs of
both laboratory and wild Mus musculus [217],
and of Drosophila [379] gave H values of 0-0.02.
Only in the case of 2-D studies of human plasma
proteins was an H value (0.062) found to agree
with the 1-D electrophoresis H value (0.063) from
104 human loci [352].
4.3.3 Dependence of Protein Polymorphism
on Protein 1YPe
The extent of polymorphism differs greatly
between different proteins (Table 4.9). In connection with the controversy over neutralism and
selectionism, there have been many investigations of which protein properties determine
the extent of polymorphism. According to the
neutral theories, polymorphism should increase
with increasing molecular mass, because the
probability of neutral amino acid substitutions
increases with the number of amino acids; such a
tendency was confirmed in studies involving a
large amount of data [294]. Polymorphism is
dependent upon the quaternary structure; it is
larger for monomers than for di- or tetrameric
enzyme proteins (Table 4.10). Neutral theories
explain this relationship by restricted variability
in the regions of contact. It should be noted,
however, that amongst the proteins with marked
polymorphism are several multimeric enzymes,
Table 4.9. The heterozygosity (H values) of various proteins: (a) considering all Drosophila species examined; (b) considering all invertebrate and vertebrate species examined [331]
Protein
Heterozygosity
Function
type"
a
b
Xanthine dehydrogenase (XDH)
0.364
0.208
R
Phosphoglucose isomerase (PGI)
0.353
0.134
R
Esterase (EST)
0.341
0.277
U
Acetaldehyde oxidase (AO)
0.321
R
Amylase (AMY)
0.321
N
Acid phosphatase (ACPH)
0.259
0.224
U
Peptidases (PEP, LAP)
0.235
0.192
U
Adenylate kinase (AD KIN)
0.215
0.136
R
Phosphoglucomutase (PGM)
0.199
0.170
R
Glucose-6-phosphate dehydrogenase (G6PDH)
0.168
0.121
N
Alcohol dehydrogenase (ADH)
0.152
0.140
R
lsocitrate dehydrogenase (IDH)
0.127
0.082
N
Malate enzyme (ME)
0.117
0.131
R
Hexokinase (HK)
0.077
0.087
R
Aspartate transaminase (GOT)
0.075
0.057
N
Non-enzymatic proteins
0.071
0.066
Superoxide dismutase (SOD)
0.070
0.080
U
Fumarase (FUM)
0.050
0.041
N
Malate dehydrogenase (MDH)
0.037
0.083
N
6-Phosphogluconate dehydrogenase (6PGDH)
0.037
0.039
N
a-Glyceraldehyde-3-phosphate dehydrogenase (a-GPDH)
0.013
0.039
N (insects)
R (others)
Triosephosphate isomerase (TIM)
0.012
0.054
N
Relatively unspecific enzymes
0.205
0.175
U
Specific regulatory enzymes
0.210
0.161
R
Specific nonregulatory enzymes
0.086
0.073
N
" Function type according to Johnson: U, relatively unspecific enzyme; R, specific regulatory enzyme; N, specific nonregulatory enzyme.