

256
A. Collin et al.
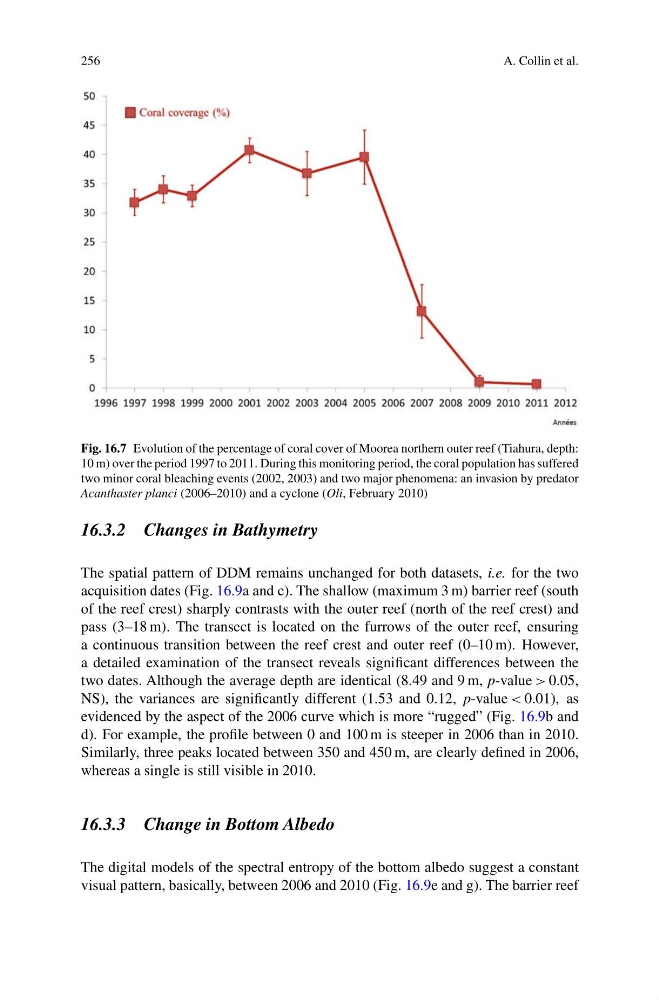
Fig. 16.7 Evolution of the percentage of coral cover of Moorea northern outer reef (Tiahura, depth:
10 m) over the period 1997 to 2011. During this monitoring period, the coral population has suffered
two minor coral bleaching events (2002, 2003) and two major phenomena: an invasion by predator
Acanthaster planci (2006–2010) and a cyclone (Oli, February 2010)
16.3.2 Changes in Bathymetry
The spatial pattern of DDM remains unchanged for both datasets, i.e. for the two
acquisition dates (Fig. 16.9a and c). The shallow (maximum 3 m) barrier reef (south
of the reef crest) sharply contrasts with the outer reef (north of the reef crest) and
pass (3–18 m). The transect is located on the furrows of the outer reef, ensuring
a continuous transition between the reef crest and outer reef (0–10 m). However,
a detailed examination of the transect reveals significant differences between the
two dates. Although the average depth are identical (8.49 and 9 m, p-value > 0.05,
NS), the variances are significantly different (1.53 and 0.12, p-value < 0.01), as
evidenced by the aspect of the 2006 curve which is more “rugged” (Fig. 16.9b and
d). For example, the profile between 0 and 100 m is steeper in 2006 than in 2010.
Similarly, three peaks located between 350 and 450 m, are clearly defined in 2006,
whereas a single is still visible in 2010.
16.3.3 Change in Bottom Albedo
The digital models of the spectral entropy of the bottom albedo suggest a constant
visual pattern, basically, between 2006 and 2010 (Fig. 16.9e and g). The barrier reef
A. Collin et al.
Fig. 16.7 Evolution of the percentage of coral cover of Moorea northern outer reef (Tiahura, depth:
10 m) over the period 1997 to 2011. During this monitoring period, the coral population has suffered
two minor coral bleaching events (2002, 2003) and two major phenomena: an invasion by predator
Acanthaster planci (2006–2010) and a cyclone (Oli, February 2010)
16.3.2 Changes in Bathymetry
The spatial pattern of DDM remains unchanged for both datasets, i.e. for the two
acquisition dates (Fig. 16.9a and c). The shallow (maximum 3 m) barrier reef (south
of the reef crest) sharply contrasts with the outer reef (north of the reef crest) and
pass (3–18 m). The transect is located on the furrows of the outer reef, ensuring
a continuous transition between the reef crest and outer reef (0–10 m). However,
a detailed examination of the transect reveals significant differences between the
two dates. Although the average depth are identical (8.49 and 9 m, p-value > 0.05,
NS), the variances are significantly different (1.53 and 0.12, p-value < 0.01), as
evidenced by the aspect of the 2006 curve which is more “rugged” (Fig. 16.9b and
d). For example, the profile between 0 and 100 m is steeper in 2006 than in 2010.
Similarly, three peaks located between 350 and 450 m, are clearly defined in 2006,
whereas a single is still visible in 2010.
16.3.3 Change in Bottom Albedo
The digital models of the spectral entropy of the bottom albedo suggest a constant
visual pattern, basically, between 2006 and 2010 (Fig. 16.9e and g). The barrier reef